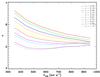
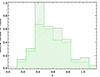
Fig. 4
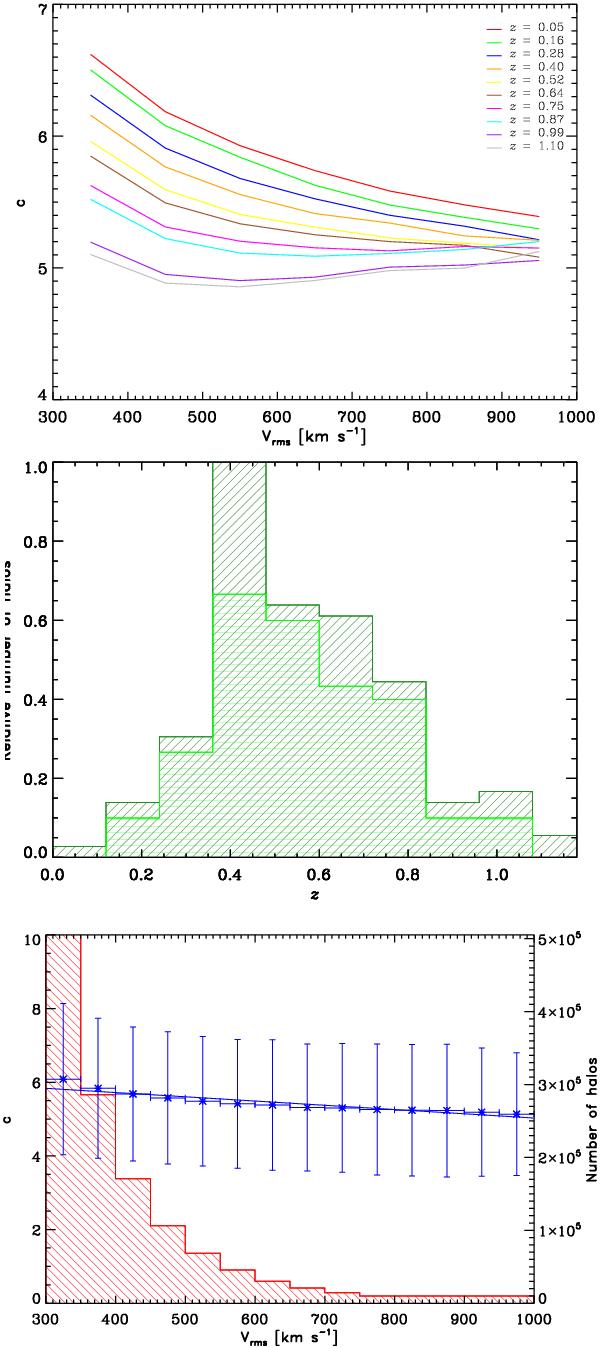
Top panel: c − Vrms relationship for different redshifts calculated from our simulations (see discussion in the text). Middle panel: relative number of halos calculated from the number of strong lensing groups observed in each redshift bin (according to Foëx et al. 2013). Dark green histogram with tilted lines shows the results from the whole sample, light green histogram with horizontal lines those for the secure candidates. Bottom panel: c − Vrms obtained mixing, in each velocity bin, halos at different redshifts, where the relative number of halos at each redshift are equal to the observed ones, i.e., given by the fraction depicted in the middle panel. The histogram in red show the total number of halos in each velocity bin.
Current usage metrics show cumulative count of Article Views (full-text article views including HTML views, PDF and ePub downloads, according to the available data) and Abstracts Views on Vision4Press platform.
Data correspond to usage on the plateform after 2015. The current usage metrics is available 48-96 hours after online publication and is updated daily on week days.
Initial download of the metrics may take a while.