Fig. 3
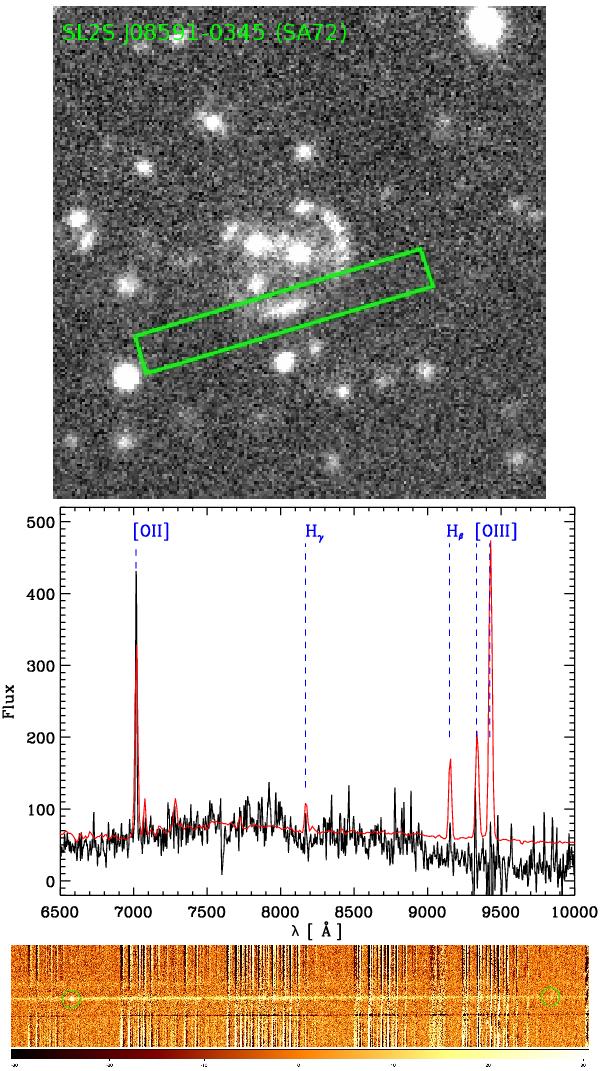
Top panel: CFHTLS g-band image of SL2S J08591−0345 showing the slit position over arc A (see also second row, left panel in Fig. 8). Middle panel: observed spectrum of arc A (black continuous line). In red we depict a starburst template from Kinney et al. (1996) shifted at z = 0.883. Some emission lines are identified, e.g., [OII]λ3727, Hγ, and Hβ. Bottom panel: two-dimensional spectra of the same arc. We note the [OII]λ3727 and Hβ emission lines.
Current usage metrics show cumulative count of Article Views (full-text article views including HTML views, PDF and ePub downloads, according to the available data) and Abstracts Views on Vision4Press platform.
Data correspond to usage on the plateform after 2015. The current usage metrics is available 48-96 hours after online publication and is updated daily on week days.
Initial download of the metrics may take a while.