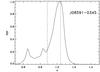
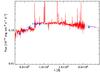
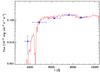
Fig. 2
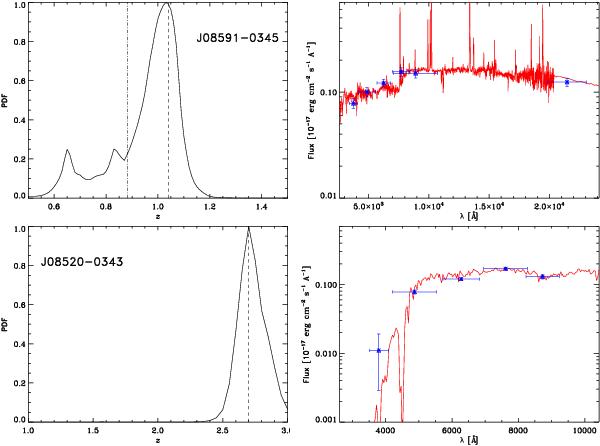
Left column: output photometric redshift PDF for the selected arcs (see text). The dashed vertical lines corresponds to the best redshift estimation. In SL2S J08591−0345 the dash-dotted line corresponds to the spectroscopic value. Right column: best fit spectral energy distribution. Points with error bars are the observed CFHTLS broadband magnitudes and ks from WIRCam (vertical error bars correspond to photometric errors, horizontal error bars represent the range covered by the filter).
Current usage metrics show cumulative count of Article Views (full-text article views including HTML views, PDF and ePub downloads, according to the available data) and Abstracts Views on Vision4Press platform.
Data correspond to usage on the plateform after 2015. The current usage metrics is available 48-96 hours after online publication and is updated daily on week days.
Initial download of the metrics may take a while.