Fig. 11
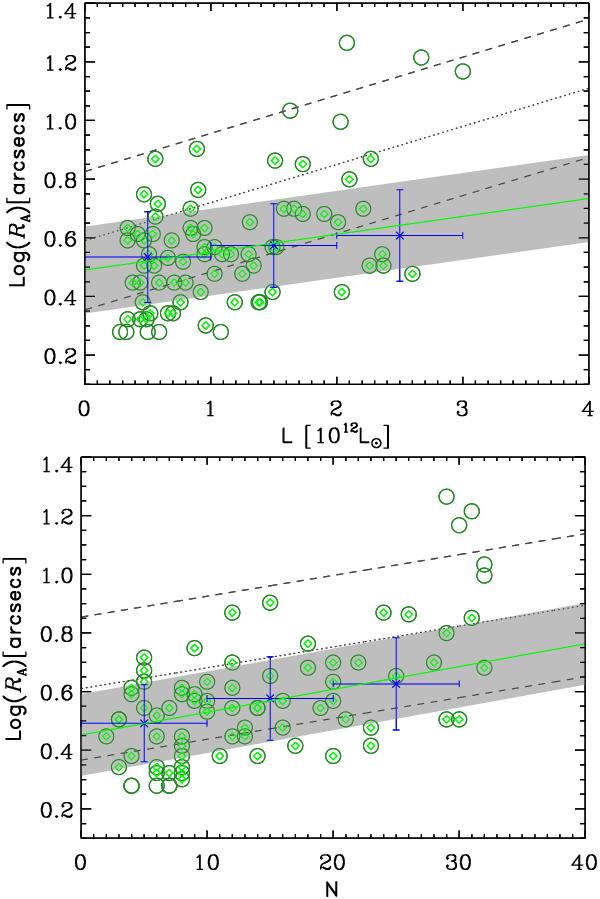
Top panel: RA as a function of the luminosity. Green circles depict the secure group candidates in Foëx et al. (2013), green diamonds those with 2.0′′ ≤ RA ≤ 8.0′′. Bottom panel: RA as a function of optical richness. The quantities were measured within an aperture of 0.5 Mpc. The green continuous line shows the fit to the green diamonds, with the 1σ-error depicted as a gray shaded region. Blue asterisks with error bars are plotted to highlight the correlation between RA and luminosity or optical richness after binning the data. The dotted line shows the relations reported by Zitrin et al. (2012) with a dispersion depicted by the two dashed lines (see Sect. 5.2).
Current usage metrics show cumulative count of Article Views (full-text article views including HTML views, PDF and ePub downloads, according to the available data) and Abstracts Views on Vision4Press platform.
Data correspond to usage on the plateform after 2015. The current usage metrics is available 48-96 hours after online publication and is updated daily on week days.
Initial download of the metrics may take a while.