Fig. 8
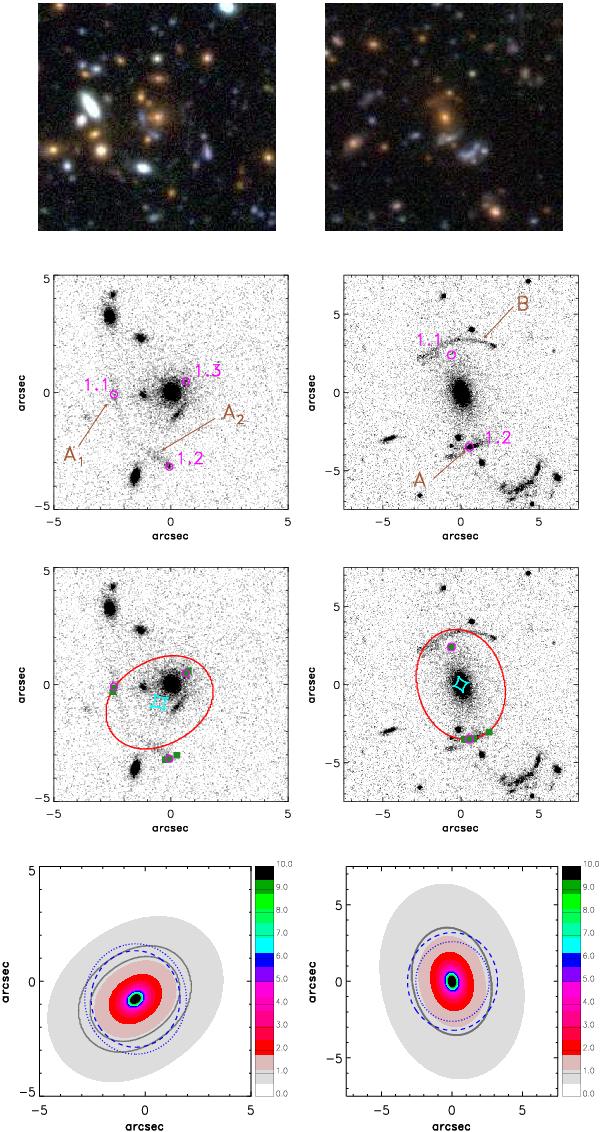
continued. SL2S J09595+0218 (SA80) and SL2S J10021+0211 (SA83), left and right columns, respectively. First row: composite CFHTLS g, r, i color images (30″× 30″). Second row: identification of the arcs and their substructure in each lens (see Sect. 4.3). Third row: critical (red) and caustic lines (cyan) for the strong lensing models. The magenta circles show the measured positions of the image (input data for the model) and the green filled squares the model-predicted image positions. Fourth row: convergence maps. For a source located at the respective redshifts, zs, given in Table 4. Dark gray lines shows κ = 1 for sources located in (zphot − δzphot, zphot + δzphot). Dotted blue lines and dashed blue lines depict the values for RA, and θE,III, respectively.
Current usage metrics show cumulative count of Article Views (full-text article views including HTML views, PDF and ePub downloads, according to the available data) and Abstracts Views on Vision4Press platform.
Data correspond to usage on the plateform after 2015. The current usage metrics is available 48-96 hours after online publication and is updated daily on week days.
Initial download of the metrics may take a while.