Free Access
Fig. 21
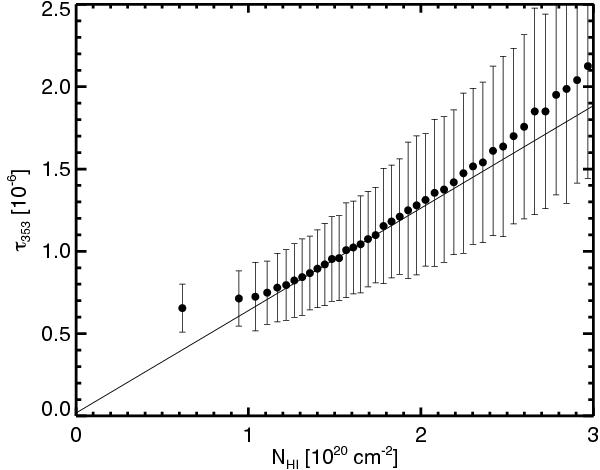
τ353 as a function of NH i estimated at 30′ resolution. Each point and its associated bar is the mean and standard deviation of τ353 in bins of NH i. The solid line is the linear regression fit using pixels for which 1.2 <NHI< 2.5 × 1020 cm-2. Its parametrization is τ353 = 6.3 ± 0.1 × 10⁻²⁷NH i − 0.02 × 10⁻⁶.
Current usage metrics show cumulative count of Article Views (full-text article views including HTML views, PDF and ePub downloads, according to the available data) and Abstracts Views on Vision4Press platform.
Data correspond to usage on the plateform after 2015. The current usage metrics is available 48-96 hours after online publication and is updated daily on week days.
Initial download of the metrics may take a while.