Fig. 2
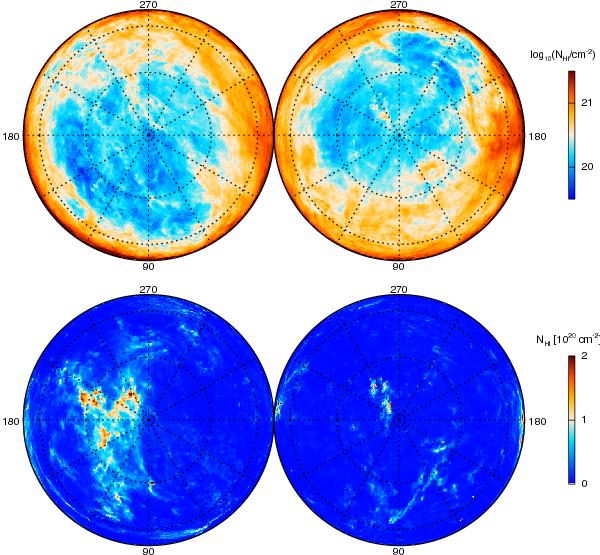
Polar orthographic projections of the LVC map (upper) and the IVC map (lower) shown in Fig. 1. The left (right) panel is centred on the north (south) Galactic pole. Longitude increases clockwise (anticlockwise), with the two panels joining at l = 0° and b = 0°. Dotted lines representing constant longitude and latitude are spaced by 30°. The radius from the pole is ∝cos(b), so this projection emphasizes features at high latitude.
Current usage metrics show cumulative count of Article Views (full-text article views including HTML views, PDF and ePub downloads, according to the available data) and Abstracts Views on Vision4Press platform.
Data correspond to usage on the plateform after 2015. The current usage metrics is available 48-96 hours after online publication and is updated daily on week days.
Initial download of the metrics may take a while.