Fig. 7
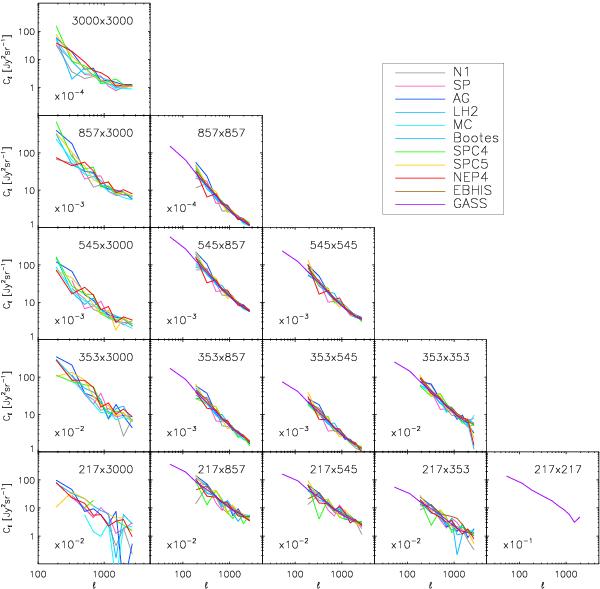
Auto- and cross-power spectra of the CIB for each field (but EBHIS, Bootes and GASS at 3000 GHz, see Sect. 3.3). For readability, error bars on individual measurements are not plotted. For the 217 × 217 case, measurements on the flat-sky fields are noise dominated, and we thus use only the results from the GASS field. For display purpose, power spectra have been multiplied by the number given at the bottom-left side of each panel.
Current usage metrics show cumulative count of Article Views (full-text article views including HTML views, PDF and ePub downloads, according to the available data) and Abstracts Views on Vision4Press platform.
Data correspond to usage on the plateform after 2015. The current usage metrics is available 48-96 hours after online publication and is updated daily on week days.
Initial download of the metrics may take a while.