Fig. 3
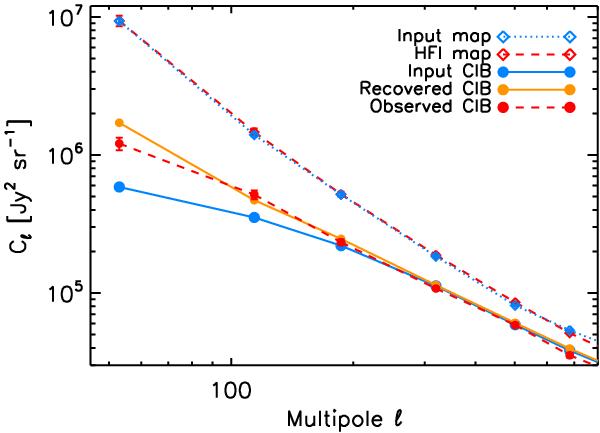
Power spectrum analysis of the simulations made at 857 GHz in the GASS field to characterize cirrus residuals. The blue and red diamonds compare the power spectrum of our simulated and HFI maps, respectively, while the blue and orange dots are the simulated and recovered CIB, respectively. The recovered CIB is biased by cirrus residuals at low multipoles. The measured CIB (obtained on the GASS Mask1 field, displayed with all but cirrus error bars) shows the same behaviour at low multipoles. Thus the measurements in the first two ℓ bins have to be considered as upper limits. As discussed in Sect. 3.2.2, the simulations are used to compute the error bars linked to the cirrus removal.
Current usage metrics show cumulative count of Article Views (full-text article views including HTML views, PDF and ePub downloads, according to the available data) and Abstracts Views on Vision4Press platform.
Data correspond to usage on the plateform after 2015. The current usage metrics is available 48-96 hours after online publication and is updated daily on week days.
Initial download of the metrics may take a while.