Fig. 2
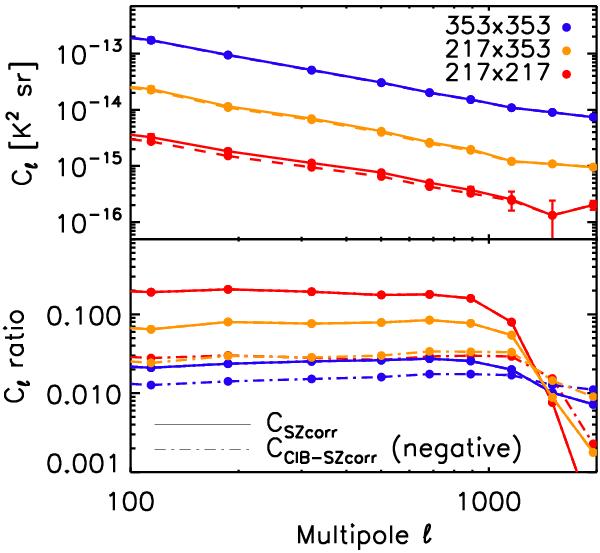
Top: residual map (a.k.a CIB) auto- and cross-spectra measured at 217 and 353 GHz (circles). The dashed lines represent the measured power spectra corrected for the tSZ contamination (both tSZ and tSZ×CIB, see Eqs. (8) and (9), respectively). Bottom: absolute value of the ratio ![]() (continuous line) and
(continuous line) and ![]() (dot-dashed line, negative). The highest contamination is for the 217 × 217 power spectrum, where the total correction represents about 15% of the measured CIB power spectrum. For
(dot-dashed line, negative). The highest contamination is for the 217 × 217 power spectrum, where the total correction represents about 15% of the measured CIB power spectrum. For ![]() , the uncertainty is about 10%. On the contrary,
, the uncertainty is about 10%. On the contrary, ![]() is poorly constrained, as the model used to compute it is uncertain by a factor of two.
is poorly constrained, as the model used to compute it is uncertain by a factor of two.
Current usage metrics show cumulative count of Article Views (full-text article views including HTML views, PDF and ePub downloads, according to the available data) and Abstracts Views on Vision4Press platform.
Data correspond to usage on the plateform after 2015. The current usage metrics is available 48-96 hours after online publication and is updated daily on week days.
Initial download of the metrics may take a while.