Fig. 18
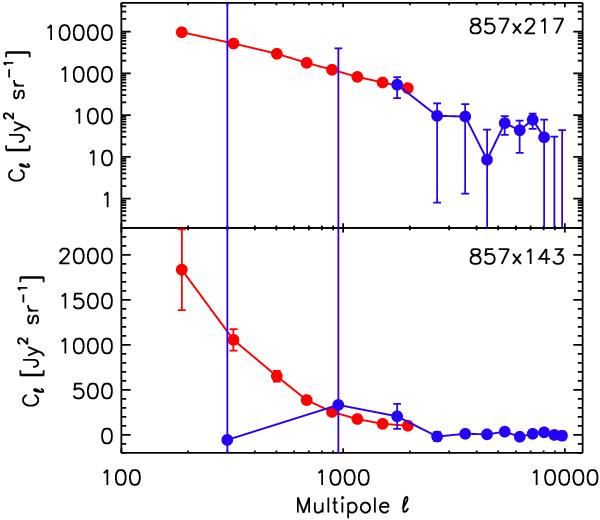
Planck (red dots) and BLAST×ACT (blue dots from Hajian et al. 2012) CIB power spectra. Only the clustered CIB is shown (the shot-noise contributions have been removed, since they are very different in the two measurements). No colour corrections have been applied between HFI channels, and the 218 GHz (ACT) and 857 GHz (BLAST) channels. Note that the y-axis for the 857 × 143 cross-correlation is on a linear scale, since the BLAST×ACT measurement has negative values (due to the shot-noise removal).
Current usage metrics show cumulative count of Article Views (full-text article views including HTML views, PDF and ePub downloads, according to the available data) and Abstracts Views on Vision4Press platform.
Data correspond to usage on the plateform after 2015. The current usage metrics is available 48-96 hours after online publication and is updated daily on week days.
Initial download of the metrics may take a while.