Fig. 17
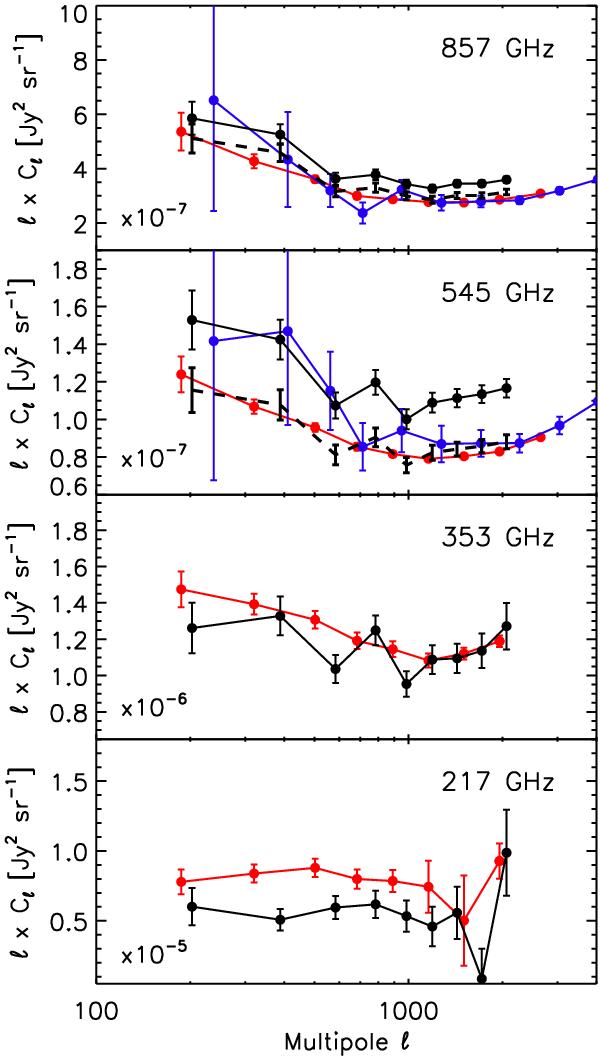
Comparison of the CIB auto-power spectra measured using SPIRE (blue dots, Viero et al. 2013b), earlier Planck data (Planck Collaboration 2011RPlanck Collaboration XVIII 2011, black dots) and in this paper (red circles). The SPIRE data have been colour corrected to be compared with HFI (see text). The dashed lines show the Planck Collaboration 2011RPlanck Collaboration XVIII (2011) CIB measurements, rescaled at 857 and 545 GHz by the photometric re-calibration factors (1.072 and 1.152, for the power spectra at 857 and 545 GHz, respectively, see Planck Collaboration 2013HPlanck Collaboration VIII 2014). At 217 GHz, the difference between the black and red points is due to the tSZ and CIB contamination of the CMB template that is now corrected for. For display purpose, power spectra have been multiplied by the number given at the bottom-left side of each panel.
Current usage metrics show cumulative count of Article Views (full-text article views including HTML views, PDF and ePub downloads, according to the available data) and Abstracts Views on Vision4Press platform.
Data correspond to usage on the plateform after 2015. The current usage metrics is available 48-96 hours after online publication and is updated daily on week days.
Initial download of the metrics may take a while.