Fig. 15
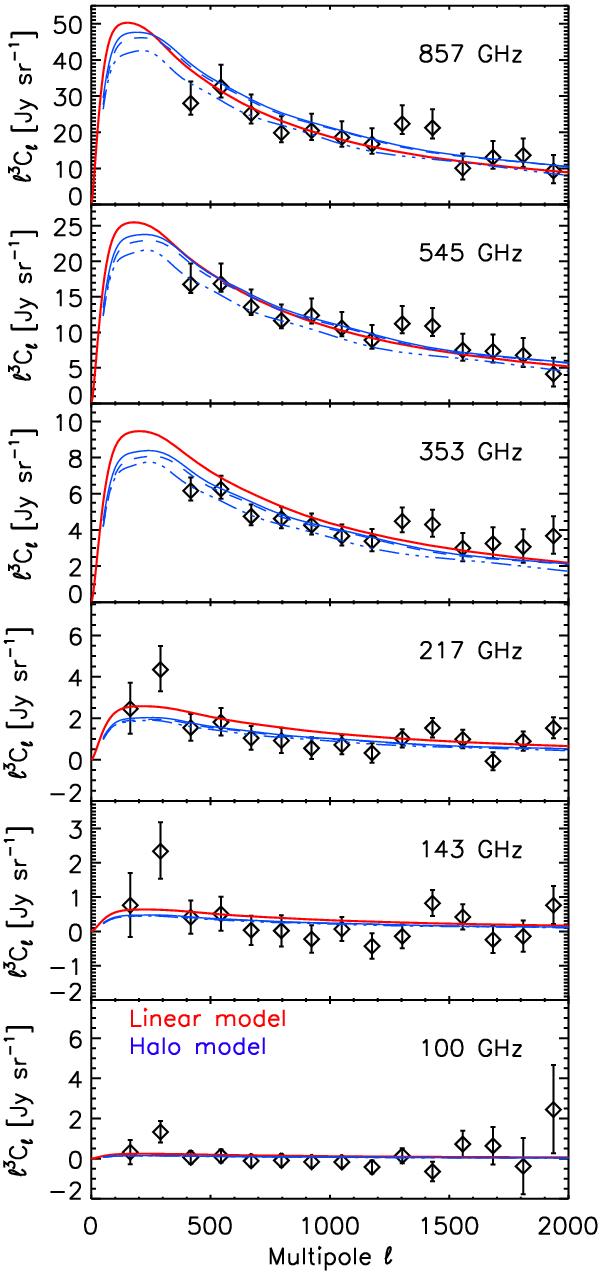
Comparison between the measurements of the CIB and gravitational potential cross-correlation given in Planck Collaboration 2013RPlanck Collaboration XVIII (2014) (diamonds), with the predictions from our best-fit models of the CIB cross-power spectra (red and blue solid lines for the linear and extended halo model, respectively). The other curves are the two variants of the extended halo model with: (i) a break in the global normalization of the L–M relation fixed at redshift z = 2 (blue 3-dot-dashed curve); and (ii) a break in both the temperature evolution and normalization of the L–M relation, found at redshift z = 4.2 ± 0.5 (blue long-dashed curve).
Current usage metrics show cumulative count of Article Views (full-text article views including HTML views, PDF and ePub downloads, according to the available data) and Abstracts Views on Vision4Press platform.
Data correspond to usage on the plateform after 2015. The current usage metrics is available 48-96 hours after online publication and is updated daily on week days.
Initial download of the metrics may take a while.