Fig. 11
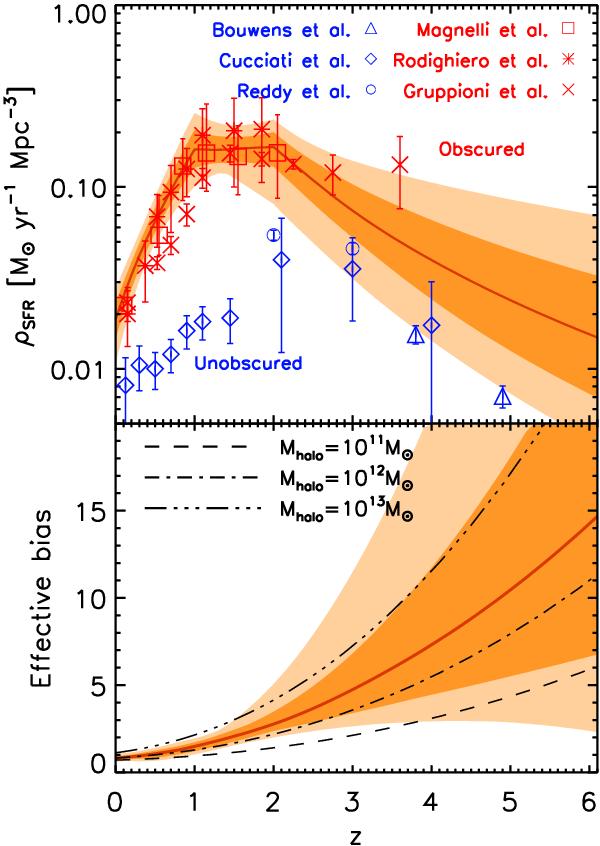
Evolution of the star formation density (upper panel) and effective bias as a function of redshift (lower panel), as constrained by the linear part of the power spectra. In both panels, the median realization of the model is represented with a red line, the ± 1σ confidence region with a dark orange area, and the ± 2σ region with a light orange area. In the upper panel, we added the measurements of obscured star formation from infrared Magnelli et al. 2011, squares; Rodighiero et al. 2010, asterisks; Cucciati et al. 2012, diamonds; Gruppioni et al. 2013, crosses, and unobscured star formation from uncorrected UV (Bouwens et al. 2007, triangles; Reddy & Steidel 2009, circles). In the lower panel, we also plot the evolution of the dark matter halo bias for dark matter halo mass of 1011M⊙ (dashed line), 1012M⊙ (dot-dashed line), and 1013M⊙ (three-dots-dashed line).
Current usage metrics show cumulative count of Article Views (full-text article views including HTML views, PDF and ePub downloads, according to the available data) and Abstracts Views on Vision4Press platform.
Data correspond to usage on the plateform after 2015. The current usage metrics is available 48-96 hours after online publication and is updated daily on week days.
Initial download of the metrics may take a while.