Fig. 10
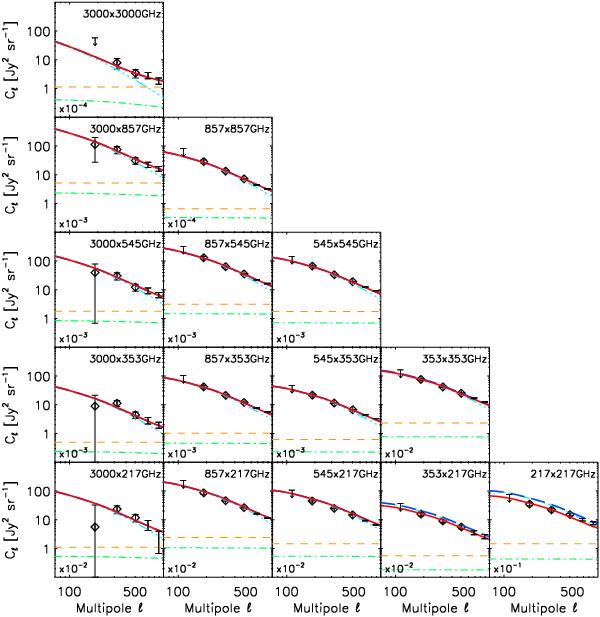
(Cross-) power spectra of the CIB measured by IRAS and Planck, and the linear model. Data points are shown in black. The data used to fit the linear model are represented by diamonds (ℓ ≤ 600). High-ℓ points are not displayed, as they are not used. The cyan dash-three-dot line (often lying under the red continuous line) is the best-fit CIB linear model. For completeness, we also show on this figure the shot-noise level given in Table 6 (orange dashed line) and the 1-halo term (green dot-dashed line) predicted by Béthermin et al. (2013). The red line is the sum of the linear, 1-halo and shot-noise components; it contains the spurious CIB introduced by the CMB template (see Sect. 3.1.2). The blue long-dashed line represents the CIB linear best-fit model plus 1-halo and shot-noise terms; it is corrected for the CIB leakage in the CMB map, similarly to the cyan line. When the CIB leakage is negligible, the blue long-dashed line is the same as the red continuous line.
Current usage metrics show cumulative count of Article Views (full-text article views including HTML views, PDF and ePub downloads, according to the available data) and Abstracts Views on Vision4Press platform.
Data correspond to usage on the plateform after 2015. The current usage metrics is available 48-96 hours after online publication and is updated daily on week days.
Initial download of the metrics may take a while.