Fig. 8
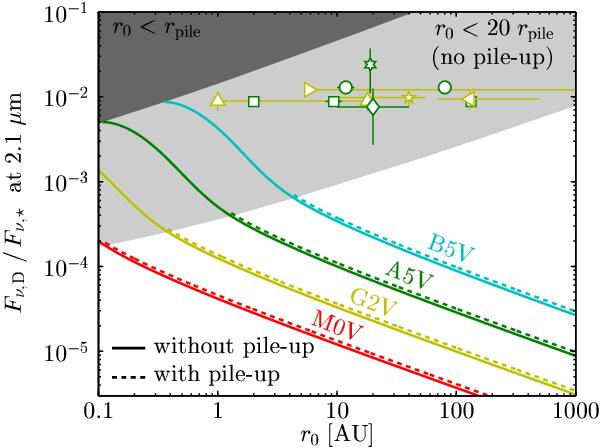
Flux ratio between the disk and the star at 2.1 μm (K band), as function of parent belt radius r0. Solid lines indicate the flux ratio due to the maximum amount of material moved in by P–R drag, truncated at r = rpile. Ratios including the small effect due to pile-up are shown with dashed lines. Different colors are used for different stellar types. The light shaded area marks the region in parameter space where no significant pile-up is expected to occur because the orbits of small dust grains cannot circularize sufficiently (see Eq. (22)). The dark shaded area marks where the parent belt r0 is closer than the pile-up radius rpile. The observed K-band excess fluxes of main-sequence stars from Table 1 are shown at their respective estimated parent belt distances with a different symbol for each star and coloring according to the star’s spectral type: Vega (the CHARA/FLUOR measurement): circles; β Leo: hexagon; Fomalhaut: squares; β Pic: diamond; η Lep: upward pointing triangles; 110 Her: left-pointing triangle; 10 Tau: right-pointing triangle; τ Cet: pentagon.
Current usage metrics show cumulative count of Article Views (full-text article views including HTML views, PDF and ePub downloads, according to the available data) and Abstracts Views on Vision4Press platform.
Data correspond to usage on the plateform after 2015. The current usage metrics is available 48-96 hours after online publication and is updated daily on week days.
Initial download of the metrics may take a while.