Fig. 7
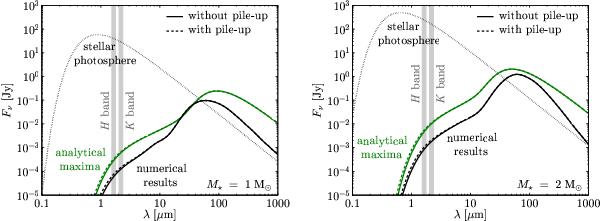
SEDs of stars and their debris disks at a distance of 10 pc. The disk SED is shown for different dust distributions with the numerical results in black and the analytical distributions in green. Dust distributions including the pile-up of dust in the sublimation zone are shown with dashed lines, and distributions in which the pile-up is excluded are shown with solid lines, but the spectra largely overlap. Disk SEDs are calculated according to Eqs. (46) and (47). The stellar photosphere is indicated by a dotted Planck curve. The vertical gray areas mark the NIR H and K bands in which hot exozodiacal dust is observed.
Current usage metrics show cumulative count of Article Views (full-text article views including HTML views, PDF and ePub downloads, according to the available data) and Abstracts Views on Vision4Press platform.
Data correspond to usage on the plateform after 2015. The current usage metrics is available 48-96 hours after online publication and is updated daily on week days.
Initial download of the metrics may take a while.