Fig. 5
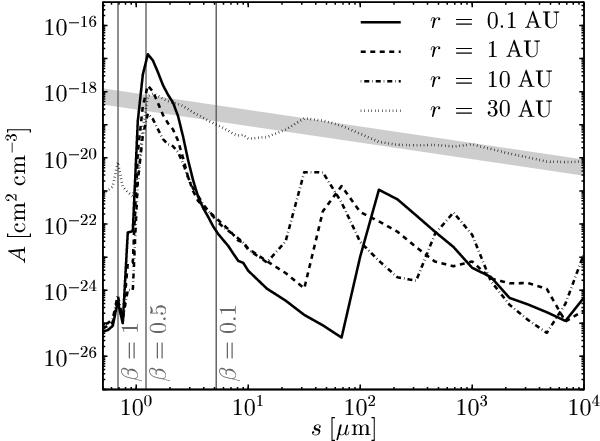
Size distributions at different radial distances for the M⋆ = 1 M⊙ run before switching on sublimation. The quantity on the vertical axis, A, is the cross-section density per unit size decade (see Appendix C.2), which is horizontal if all sizes contribute equally to the cross-section. The gray band indicates the slope of a size distribution that follows the classical Dohnanyi (1969) power law (n(s) ∝ s-3.5, hence A ∝ s-0.5). The vertical lines mark the particle sizes corresponding to relevant values of β.
Current usage metrics show cumulative count of Article Views (full-text article views including HTML views, PDF and ePub downloads, according to the available data) and Abstracts Views on Vision4Press platform.
Data correspond to usage on the plateform after 2015. The current usage metrics is available 48-96 hours after online publication and is updated daily on week days.
Initial download of the metrics may take a while.