Fig. 1
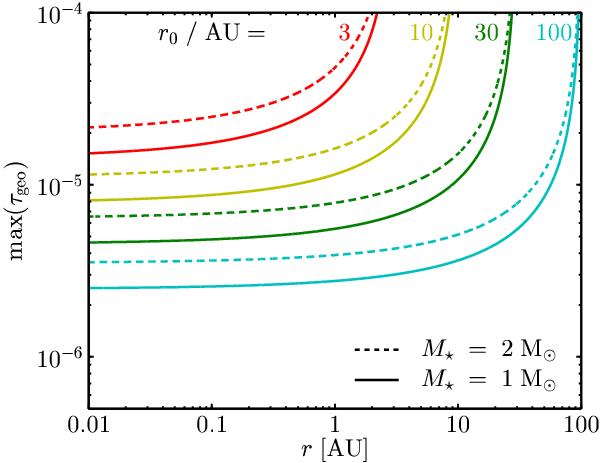
Maximum geometrical optical depth as a function of distance to the star (Eq. (5)). The profiles are derived from the analytical model of Wyatt (2005), in which dust is produced by a source at radius r0 and subsequently migrates inward due to P–R drag, while suffering destruction from mutual collisions. The solid lines correspond to solar-mass stars, the dashed lines to 2 M⊙ stars. Profiles for different parent belt locations are shown in different colors. All profiles assume dust grains with β = 0.5.
Current usage metrics show cumulative count of Article Views (full-text article views including HTML views, PDF and ePub downloads, according to the available data) and Abstracts Views on Vision4Press platform.
Data correspond to usage on the plateform after 2015. The current usage metrics is available 48-96 hours after online publication and is updated daily on week days.
Initial download of the metrics may take a while.