Fig. 12
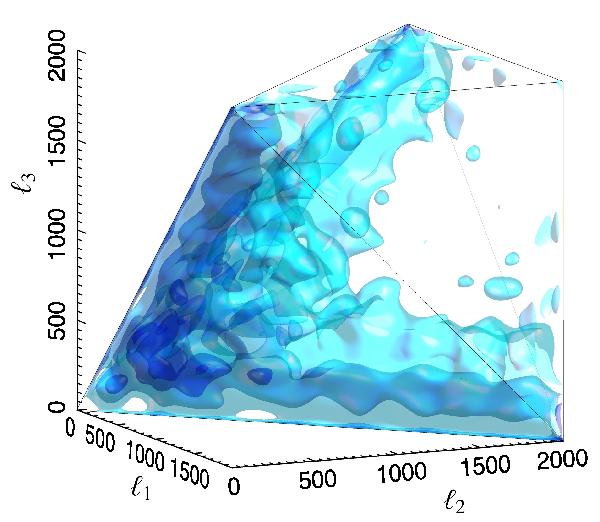
Modal reconstruction of the post-recombination string bispectrum Eq. (15) extracted from Planck resolution map simulations. This is a 3D view of the allowed tetrahedral set of multipoles (ℓ1,ℓ2,ℓ3) showing isosurfaces of the bispectrum density with darker blue for more negative values (it is normalised relative to the constant SW bispectrum).
Current usage metrics show cumulative count of Article Views (full-text article views including HTML views, PDF and ePub downloads, according to the available data) and Abstracts Views on Vision4Press platform.
Data correspond to usage on the plateform after 2015. The current usage metrics is available 48-96 hours after online publication and is updated daily on week days.
Initial download of the metrics may take a while.