Fig. 7
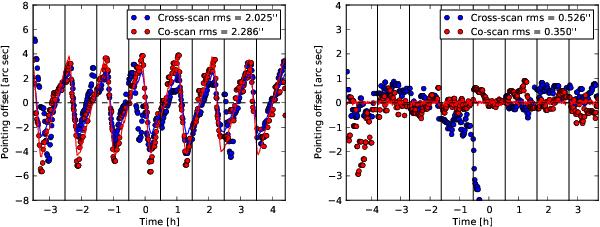
Measured intermediate frequency pointing errors at one minute intervals. The plotted time span covers the period that Jupiter is within one FWHM of the 143-1a bolometer beam center. The offsets were smoothed with a five-point median filter. Vertical lines mark the pointing period boundaries. The overplotted solid line is the scaled and translated REBA temperature. REBA thermal control was adjusted between Jupiter transits two and three. Left: pointing fluctuations during the second Jupiter transit. Right: fluctuations during the third Jupiter transit, after the REBA thermal control was adjusted. Note the different vertical scales.
Current usage metrics show cumulative count of Article Views (full-text article views including HTML views, PDF and ePub downloads, according to the available data) and Abstracts Views on Vision4Press platform.
Data correspond to usage on the plateform after 2015. The current usage metrics is available 48-96 hours after online publication and is updated daily on week days.
Initial download of the metrics may take a while.