Fig. B.3
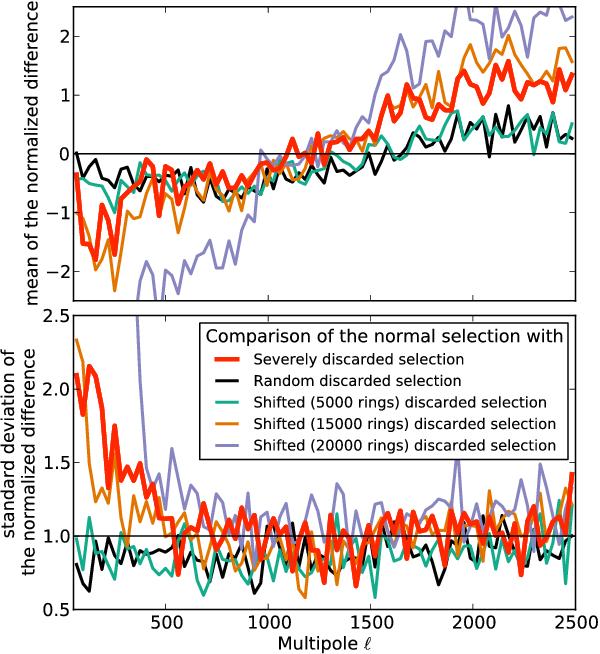
Binned difference between the severe and the normal pseudo-spectra at 143 GHz in units of the expected standard deviation. If our assumptions are correct, the residual noise has a Gaussian distribution centred on zero with a variance of one. The top and bottom panels represents the mean and standard deviation of the difference in bins of 31 samples, obtained from the data in Fig. 28. The black points represent a sanity check where the rings have been discarded randomly, and the blue, orange and green lines represent three sanity checks where the selection of discarded rings has been shifted with respect to the severe one.
Current usage metrics show cumulative count of Article Views (full-text article views including HTML views, PDF and ePub downloads, according to the available data) and Abstracts Views on Vision4Press platform.
Data correspond to usage on the plateform after 2015. The current usage metrics is available 48-96 hours after online publication and is updated daily on week days.
Initial download of the metrics may take a while.