Fig. 34
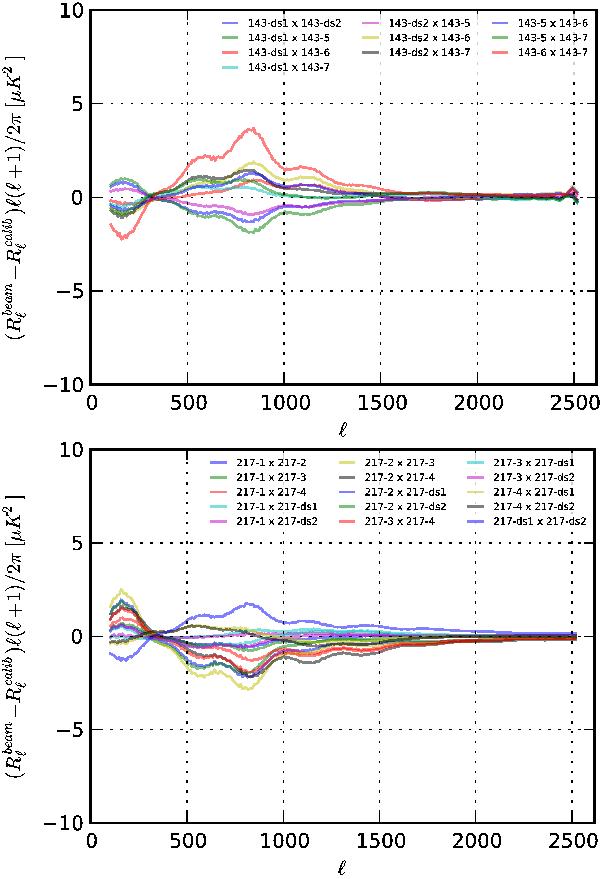
Derived overall beam correction of each detector set which minimizes their mismatch, given the model used (Eq. (4)). This is plotted for 143 and 217 GHz, where there are sufficient data to simultaneously estimate beam parameters along with signal and noise power spectra. These corrections peak around ℓ ~ 200 and 800 and are at most of the order of 3 μK2.
Current usage metrics show cumulative count of Article Views (full-text article views including HTML views, PDF and ePub downloads, according to the available data) and Abstracts Views on Vision4Press platform.
Data correspond to usage on the plateform after 2015. The current usage metrics is available 48-96 hours after online publication and is updated daily on week days.
Initial download of the metrics may take a while.