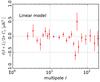
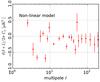
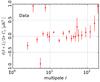
Fig. 31

Simulated effect of the ADC nonlinearity on the Survey 1 − Survey 2 difference at 143 GHz. Top: difference test of a single realization of the full pipeline, assuming a linear response of the ADC. Middle: the same, but with our current best model of the nonlinearity response of the ADC. This can be compared with the bottom panel, which shows the result of the test applied to the delivered data in exactly the same conditions. This demonstrates that indeed the effect of ADC nonlinearity can explain most of the coherent deviation seen at ℓ ≲ 100.
Current usage metrics show cumulative count of Article Views (full-text article views including HTML views, PDF and ePub downloads, according to the available data) and Abstracts Views on Vision4Press platform.
Data correspond to usage on the plateform after 2015. The current usage metrics is available 48-96 hours after online publication and is updated daily on week days.
Initial download of the metrics may take a while.