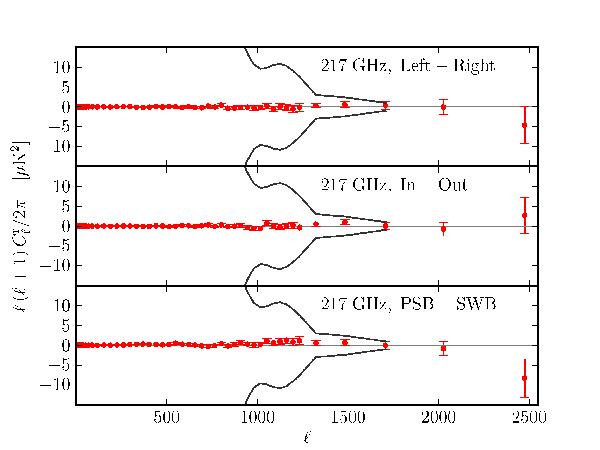
Fig. 30

Examples of map difference consistency tests at 217GHz with the fsky ≃ 0.30 mask, derived from that used in the primary cosmological analysis (see the text). The range of multipoles shown and the binning used are identical to those described in Fig. 29. We again show in each bin the variance of the Cℓ distribution from the simulations, and in black the binned sample variance for our mask. “Left” and “Right” refer to the two halves of the focal plane, whereas “In” and “Out” refer to detectors toward the centre and the periphery of the focal plane. Unlike in the survey difference test shown in Fig. 29, no significant null test failure is detected here. The detector combinations used in the example plots above are (5−8) × (1−4), (7−8) × (3−4), and (ds1−3) × (ds2−4) for, respectively, the (Left−Right), (In−Out), and (PSB−SWB) tests. As in Fig. 29, these power spectra are divided by four to allow for a direct comparison of the amplitude of the residuals to that of the components in the nominal mission power spectrum.
Current usage metrics show cumulative count of Article Views (full-text article views including HTML views, PDF and ePub downloads, according to the available data) and Abstracts Views on Vision4Press platform.
Data correspond to usage on the plateform after 2015. The current usage metrics is available 48-96 hours after online publication and is updated daily on week days.
Initial download of the metrics may take a while.


