Free Access
Fig. 15
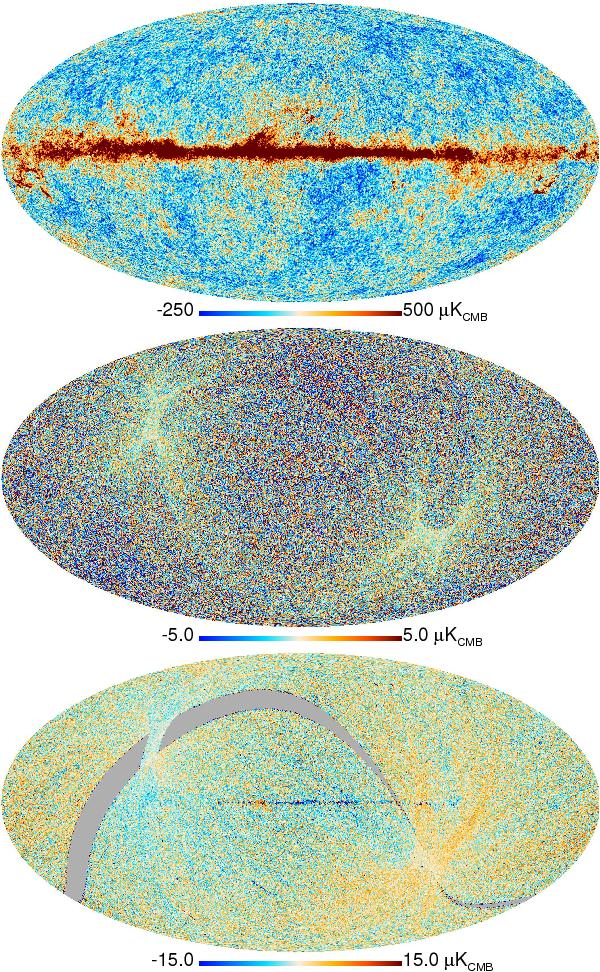
HFI maps at 100 GHz. The top panel gives the intensity in μKCMB. The middle panel shows the difference between maps made from the first and the second halves of each stable pointing period (i.e., half-ring maps). The bottom panel shows the difference between Survey 1 and Survey 2.
This figure is made of several images, please see below:
Current usage metrics show cumulative count of Article Views (full-text article views including HTML views, PDF and ePub downloads, according to the available data) and Abstracts Views on Vision4Press platform.
Data correspond to usage on the plateform after 2015. The current usage metrics is available 48-96 hours after online publication and is updated daily on week days.
Initial download of the metrics may take a while.