Fig. 10
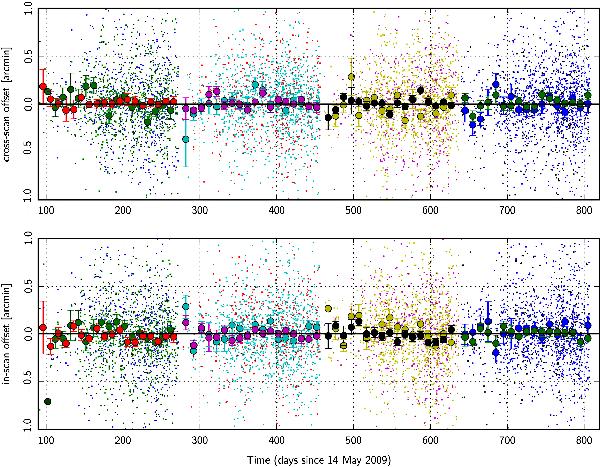
Pointing evolution from aggregate high-frequency point sources, measured by comparing point sources seen at 545 and 857 GHz to known IRAS positions. Light-coloured points show individual source deviations, points with error bars give ten-day errors. Different colours correspond to the two frequencies and four individual Planck sky surveys.
Current usage metrics show cumulative count of Article Views (full-text article views including HTML views, PDF and ePub downloads, according to the available data) and Abstracts Views on Vision4Press platform.
Data correspond to usage on the plateform after 2015. The current usage metrics is available 48-96 hours after online publication and is updated daily on week days.
Initial download of the metrics may take a while.