Fig. 5
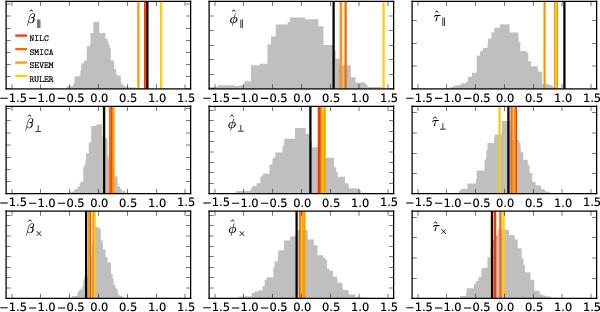
Plot of velocity amplitude estimates, similar to Fig. 4, but using an array of component-separated maps, rather than specific combinations of frequency maps. The production and characterization of these component-separated maps is presented in Planck Collaboration XII (2014). Histograms of simulation results without velocity effects are overplotted in grey for each method; they are all very similar. Vertical coloured bars correspond to the maps indicated in the legend, using the combination of our fiducial galaxy mask (which removes approximately 30% of the sky), as well as the specific mask produced for each component separation method. We see significant departures from the null-hypothesis simulations only in the β∥ direction, as expected. Vertical black lines show the 143 × 217 measurement of Fig. 4. Note the discussion about the subtleties in the normalization of these estimates in Sect. 6.
Current usage metrics show cumulative count of Article Views (full-text article views including HTML views, PDF and ePub downloads, according to the available data) and Abstracts Views on Vision4Press platform.
Data correspond to usage on the plateform after 2015. The current usage metrics is available 48-96 hours after online publication and is updated daily on week days.
Initial download of the metrics may take a while.