Fig. 4
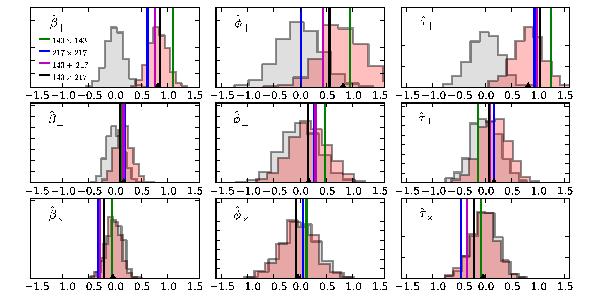
Measurements of β using combinations of the 143
and 217 GHz Planck maps, normalized using Eq. (19)and then divided by the fiducial
amplitude of β = 1.23 ×
10-3. These estimates use ℓmin = 500
and ℓmax =
2000. In addition to the total minimum variance estimate
![]() ,
the measurement is also broken down into its aberration-type part,
,
the measurement is also broken down into its aberration-type part,
![]() ,
and modulation-type part,
,
and modulation-type part, ![]() .
Vertical lines give the Planck measurement for the four estimates
described in the text. Grey histograms give the distribution of estimates for
simulations of the 143 ×
217 estimator, which do not contain peculiar velocity effects (the
other estimators are very similar). The red histograms give the distribution for
simulations which do contain peculiar velocity effects, simulated with the fiducial
direction (along β∥) and amplitude.
Black triangles on the x-axis indicate the relevant component of
fsky given by Eq. (20), which agrees well with the peak of
the velocity simulations.
.
Vertical lines give the Planck measurement for the four estimates
described in the text. Grey histograms give the distribution of estimates for
simulations of the 143 ×
217 estimator, which do not contain peculiar velocity effects (the
other estimators are very similar). The red histograms give the distribution for
simulations which do contain peculiar velocity effects, simulated with the fiducial
direction (along β∥) and amplitude.
Black triangles on the x-axis indicate the relevant component of
fsky given by Eq. (20), which agrees well with the peak of
the velocity simulations.
Current usage metrics show cumulative count of Article Views (full-text article views including HTML views, PDF and ePub downloads, according to the available data) and Abstracts Views on Vision4Press platform.
Data correspond to usage on the plateform after 2015. The current usage metrics is available 48-96 hours after online publication and is updated daily on week days.
Initial download of the metrics may take a while.