Fig. 5
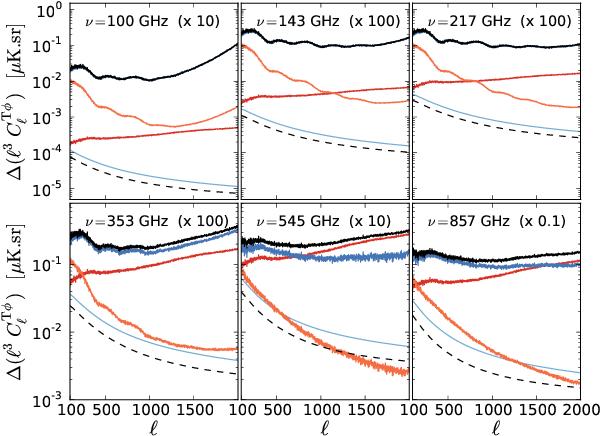
Naive analytical estimates of the contribution to the
![]() variance as a function of multipole
and frequency, as given in Eq. (4).
We assume the same bin sizes as in Fig. 3. The
different lines are the contribution to the analytical error from: the signal only,
variance as a function of multipole
and frequency, as given in Eq. (4).
We assume the same bin sizes as in Fig. 3. The
different lines are the contribution to the analytical error from: the signal only,
![]() (orange); noise only,
(orange); noise only,
![]() (dark blue); and the mixed signal
and noise terms,
(dark blue); and the mixed signal
and noise terms, ![]() (orange) and
(orange) and
![]() (red). The total contribution is the
solid black line, and the theory spectrum,
(red). The total contribution is the
solid black line, and the theory spectrum, ![]() , is the dashed black line.
, is the dashed black line.
Current usage metrics show cumulative count of Article Views (full-text article views including HTML views, PDF and ePub downloads, according to the available data) and Abstracts Views on Vision4Press platform.
Data correspond to usage on the plateform after 2015. The current usage metrics is available 48-96 hours after online publication and is updated daily on week days.
Initial download of the metrics may take a while.