Fig. 3
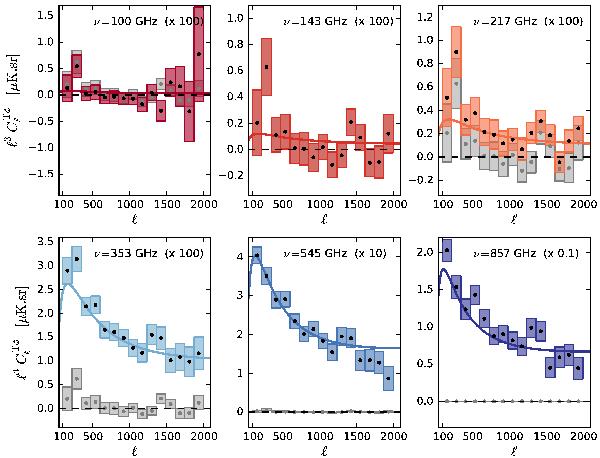
Angular cross-spectra between the reconstructed lensing map and the temperature map at the six HFI frequencies. The error bars correspond to the scatter within each band. The solid line is the expected result based on the PER model and is not a fit to these data (see Fig. 16 for an adjusted model), although it is already a satisfying model. In each panel we also show in grey the correlation between the lens reconstruction at 143 GHz and the 143 GHz temperature map. This is a simple illustration of the frequency scaling of our measured signal and also the strength of our signal as compared to possible intra-frequency systematic errors.
Current usage metrics show cumulative count of Article Views (full-text article views including HTML views, PDF and ePub downloads, according to the available data) and Abstracts Views on Vision4Press platform.
Data correspond to usage on the plateform after 2015. The current usage metrics is available 48-96 hours after online publication and is updated daily on week days.
Initial download of the metrics may take a while.