Fig. A.1
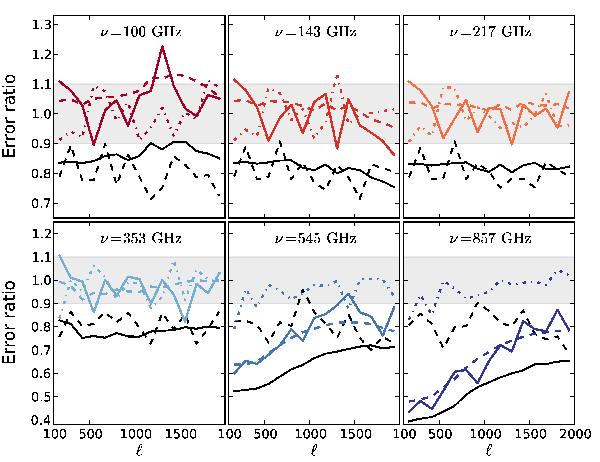
Ratio of various error estimation procedures to the errors obtained with the data-based analytical estimate. At each frequency the numerator is given by: (i) the scatter within an ℓ bin in simulations (solid black line); (ii) the scatter within an ℓ bin in the data (solid dashed black line); (iii) the scatter of bins across simulated realizations (solid coloured line); (iv) the analytical errors calculated from the simulations (dashed coloured line); and (v) the scatter across realizations for the cross-correlation between the simulated temperature map and the lensing potential reconstructed from the data (coloured dot-dashed line). The grey envelope is the precision of the simulated errors expected from 100 simulations (shown as a spread around unity).
Current usage metrics show cumulative count of Article Views (full-text article views including HTML views, PDF and ePub downloads, according to the available data) and Abstracts Views on Vision4Press platform.
Data correspond to usage on the plateform after 2015. The current usage metrics is available 48-96 hours after online publication and is updated daily on week days.
Initial download of the metrics may take a while.