Fig. 15
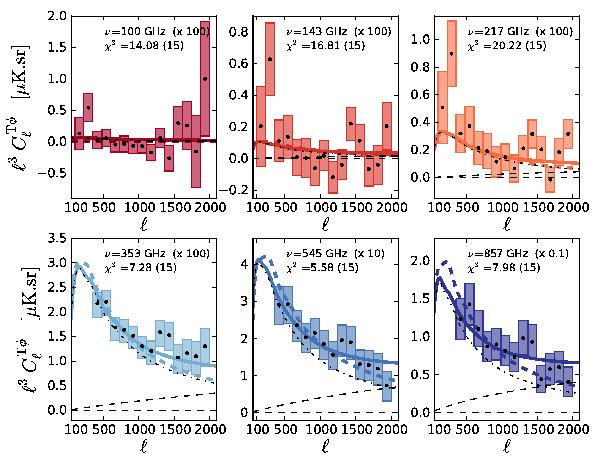
Measured cross-spectra with the best-fit mean emissivity j reconstruction model fit to both the CIB auto- and CIB-lensing cross-spectra (solid coloured), and the best-fit linear bias model (dashed coloured). The χ2 values quoted in each panel are the contribution to the global χ2 from the data in the panel for the halo model (with Nd.o.f. in brackets), and loosely indicate the goodness of fit (see text for details). The one and two-halo contributions are shown as the dot-dashed and dashed thin black lines, respectively. A light dashed black horizontal line indicates the zero level.
Current usage metrics show cumulative count of Article Views (full-text article views including HTML views, PDF and ePub downloads, according to the available data) and Abstracts Views on Vision4Press platform.
Data correspond to usage on the plateform after 2015. The current usage metrics is available 48-96 hours after online publication and is updated daily on week days.
Initial download of the metrics may take a while.