Free Access
Fig. 14
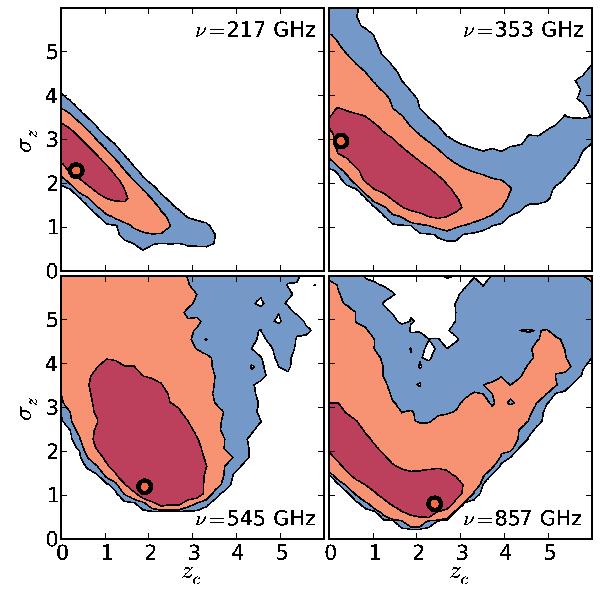
Marginalized 2D distributions of zc and σz for the linear bias model, fit to all frequencies simultaneously. The orange dots indicate the parameter values at the minimum χ2.
Current usage metrics show cumulative count of Article Views (full-text article views including HTML views, PDF and ePub downloads, according to the available data) and Abstracts Views on Vision4Press platform.
Data correspond to usage on the plateform after 2015. The current usage metrics is available 48-96 hours after online publication and is updated daily on week days.
Initial download of the metrics may take a while.