Fig. 13
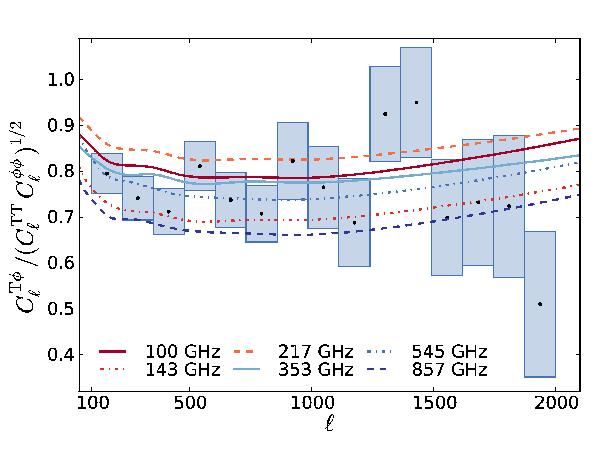
Cross-correlation coefficients calculated from the model φ spectrum and best-fit halo model at each frequency. The CIB is a spectacular tracer of CMB lensing, and vice-versa. The data points represent the measured cross-correlation divided by the best-fit auto-power spectra models at 545 GHz.
Current usage metrics show cumulative count of Article Views (full-text article views including HTML views, PDF and ePub downloads, according to the available data) and Abstracts Views on Vision4Press platform.
Data correspond to usage on the plateform after 2015. The current usage metrics is available 48-96 hours after online publication and is updated daily on week days.
Initial download of the metrics may take a while.