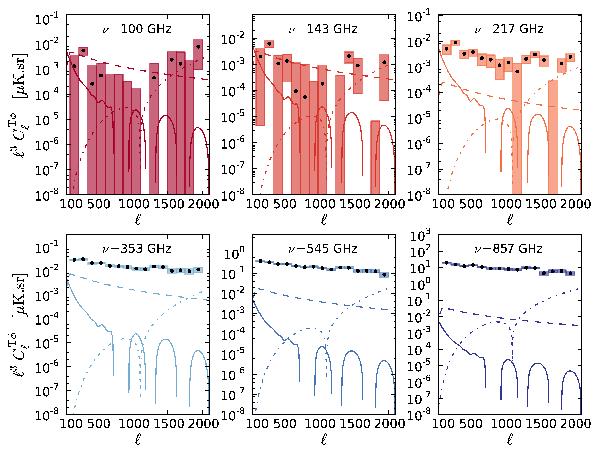
Fig. 12

Foreground components at each frequency. The data points and error bars show our results. The dashed line is an estimated upper limit on the magnitude of the SZ contamination derived in Sect. 5.3.3. We show the absolute value of this contribution, which is negative at frequencies less than 217 GHz. The dot-dashed line is the extragalactic point source contribution, with an amplitude measured from our data, as derived in Sect. 5.3.2. Again we show the absolute value, with the signal being negative below ℓ ∼ 1200. The oscillating solid line corresponds to the calculated ISW contamination.
Current usage metrics show cumulative count of Article Views (full-text article views including HTML views, PDF and ePub downloads, according to the available data) and Abstracts Views on Vision4Press platform.
Data correspond to usage on the plateform after 2015. The current usage metrics is available 48-96 hours after online publication and is updated daily on week days.
Initial download of the metrics may take a while.


