Fig. 10
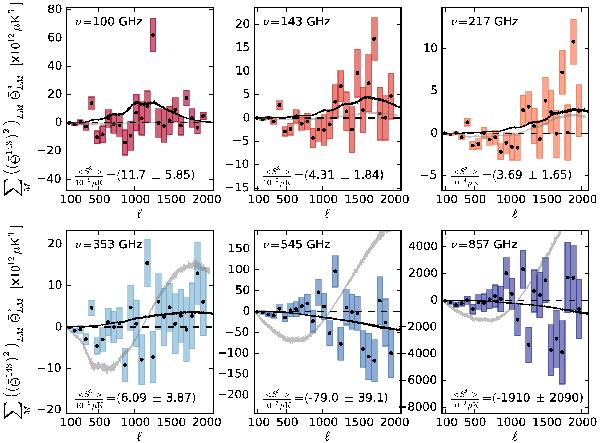
Results from the point source contamination estimator of Eq. (5). The best-fit cross-spectra associated with shot noise are plotted in black. We note that the signal-to-noise ratio at 545 and 857 GHz is particularly low. The grey line is a prediction for the bias from the CMB lensing-infrared correlation, and has been subtracted from the spectra (plotted as black points). We see that with the subtraction of the bias from CMB lensing, the measured bispectrum-related spectrum is generally consistent either with zero or with the shape expected for shot noise.
Current usage metrics show cumulative count of Article Views (full-text article views including HTML views, PDF and ePub downloads, according to the available data) and Abstracts Views on Vision4Press platform.
Data correspond to usage on the plateform after 2015. The current usage metrics is available 48-96 hours after online publication and is updated daily on week days.
Initial download of the metrics may take a while.