Fig. 4
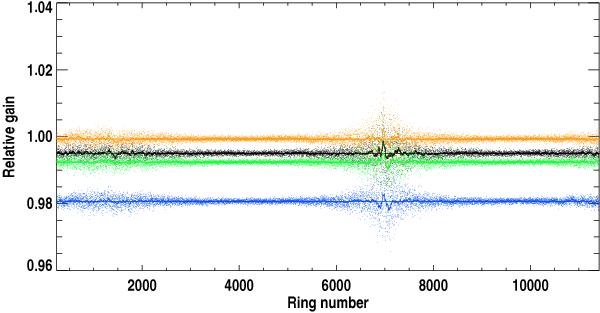
Example of results obtained with bogopix on the simulated data set used in Tristram et al. (2011), where constant gains biases were applied. The colours distinguish four different bolometers. Dots correspond to individual measurements, and the thick line is a smoothed representation of these results with a 50 ring width. We plot relative reconstructed gains, with respect to their unbiased value. In this simulation, each bolometer’s data was biased by factors of respectively 1.98 (blue), 0.77 (green), 0.50 (black) and 0.07% (orange) respectively which is precisely reflected by the recovered bogopix value.
Current usage metrics show cumulative count of Article Views (full-text article views including HTML views, PDF and ePub downloads, according to the available data) and Abstracts Views on Vision4Press platform.
Data correspond to usage on the plateform after 2015. The current usage metrics is available 48-96 hours after online publication and is updated daily on week days.
Initial download of the metrics may take a while.