Fig. 3
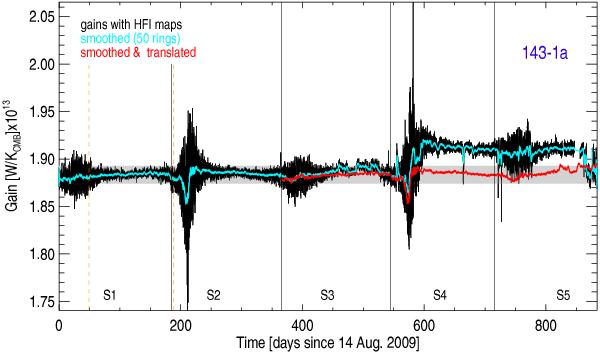
Solar dipole gain reconstructed ring-by-ring for one HFI bolometer. The thin black
line represent the raw values, and the thick cyan line is a smoothed rendition with
a width of 50 rings (about 2 days). We have indicated the conventional boundaries of
the surveys as black vertical lines. The orange vertical dashed lines indicate the
interval in which we compute the gain ![]() (computed between rings 2000 and 6000, or approximately days 60 and 190). The red
curve shows the smoothed gain variation shifted to match the repetition in Surveys 3
and 4 of the scan strategy followed in Surveys 1 and 2 (note that the scan strategy
for Survey 5 differs from that of Survey 3). The grey band highlights a
± 0.5% excursion
around the averaged gain
(computed between rings 2000 and 6000, or approximately days 60 and 190). The red
curve shows the smoothed gain variation shifted to match the repetition in Surveys 3
and 4 of the scan strategy followed in Surveys 1 and 2 (note that the scan strategy
for Survey 5 differs from that of Survey 3). The grey band highlights a
± 0.5% excursion
around the averaged gain ![]() .
The observed ~1%
variations explain the large-scale residuals seen in Fig. 1.
.
The observed ~1%
variations explain the large-scale residuals seen in Fig. 1.
Current usage metrics show cumulative count of Article Views (full-text article views including HTML views, PDF and ePub downloads, according to the available data) and Abstracts Views on Vision4Press platform.
Data correspond to usage on the plateform after 2015. The current usage metrics is available 48-96 hours after online publication and is updated daily on week days.
Initial download of the metrics may take a while.