Fig. C.5
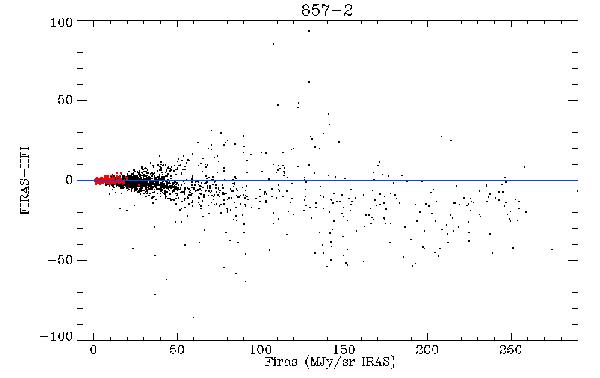
Scatter plot of FIRAS minus convolved-HFI versus FIRAS (in MJy sr-1). On average, the difference becomes more negative as the brightness increases. The red points are those used to compute the nominal calibration coefficients. HFI is clearly overestimated relative to FIRAS at high brightness.
Current usage metrics show cumulative count of Article Views (full-text article views including HTML views, PDF and ePub downloads, according to the available data) and Abstracts Views on Vision4Press platform.
Data correspond to usage on the plateform after 2015. The current usage metrics is available 48-96 hours after online publication and is updated daily on week days.
Initial download of the metrics may take a while.