Fig. 17
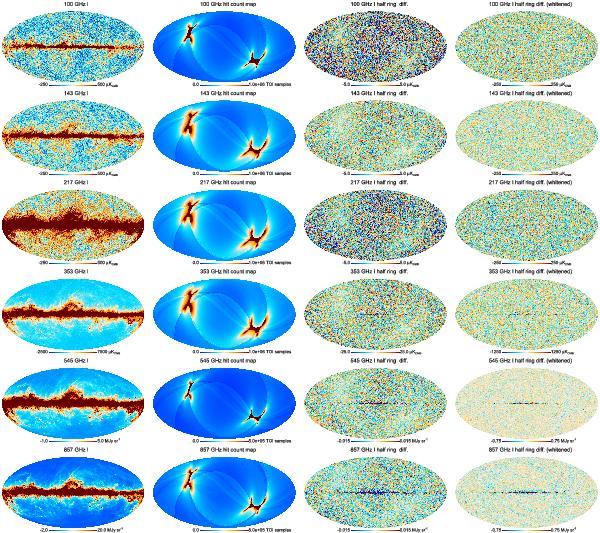
Signal (left), hit counts (second column) and half differences between maps built with only the first and second half of each ring (third column) for all HFI frequencies. The half ring differences are clearly correlated with the hit count maps. The last column shows the half-ring difference maps, scaled by the square root of the number of TOI samples, which largely removes this correlation. For the two highest frequencies, the differences show residual stripes and signal artefacts, at a low level (below 1% of the sky signal). The difference maps have been degraded to Nside = 128HEALPix resolution.
Current usage metrics show cumulative count of Article Views (full-text article views including HTML views, PDF and ePub downloads, according to the available data) and Abstracts Views on Vision4Press platform.
Data correspond to usage on the plateform after 2015. The current usage metrics is available 48-96 hours after online publication and is updated daily on week days.
Initial download of the metrics may take a while.