Fig. 13
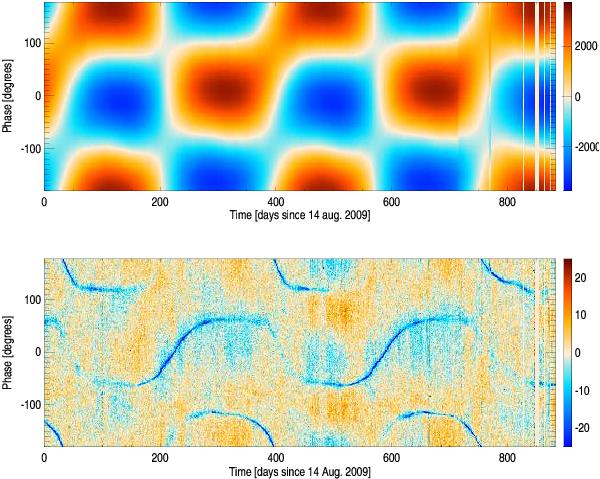
Bottom: distribution of the residuals in μKCMB, computed using Eq. (9), for detector 143-1a, plotted versus observation date and satellite rotation phase. Top: expected pattern for the solar dipole, in μKCMB. Comparison of the two plots provides a check of the level of residual gain variation after applying the bogopix gains. In the residuals the sharp features (dark blue) correspond to the Galaxy observations, where band-pass effects have not been corrected.
Current usage metrics show cumulative count of Article Views (full-text article views including HTML views, PDF and ePub downloads, according to the available data) and Abstracts Views on Vision4Press platform.
Data correspond to usage on the plateform after 2015. The current usage metrics is available 48-96 hours after online publication and is updated daily on week days.
Initial download of the metrics may take a while.