Fig. 10
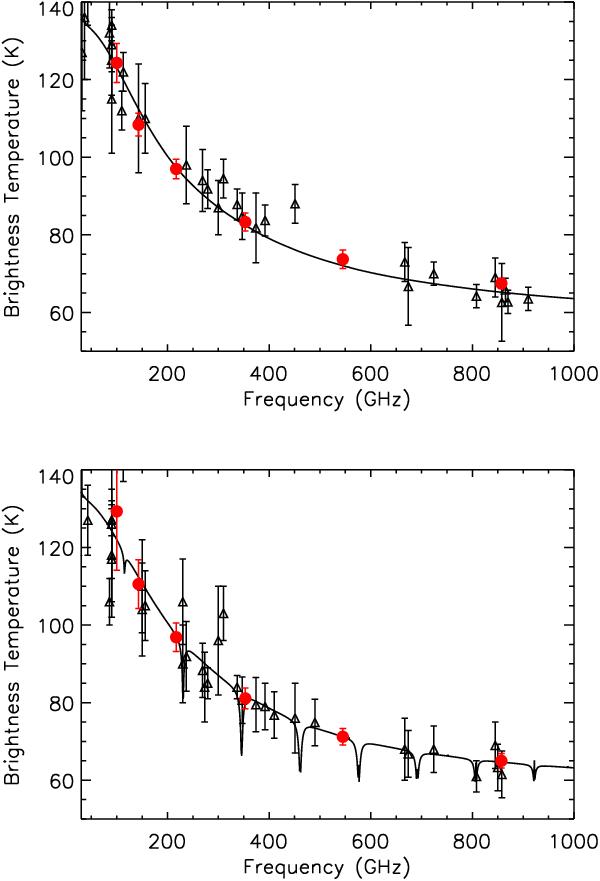
Variation of brightness temperature with frequency for Uranus (top) and Neptune (bottom). The brightness temperatures derived from the flux densities measured using aperture photometry on HFI maps are the red points. The continuous lines are the ESA2 (Uranus) and ESA3 (Neptune) models from Moreno (2010). The scale of the models is known at about the 5% level, and the relative inter-frequency uncertainty is expected to be of the order of 2%. At 545 and 857 GHz, the measurements are not independent determinations of the planet flux densities, since the 545 and 857 GHz channels have been re-calibrated to match the average of the Uranus and Neptune flux density given by the models. The other data points are extracted from the literature.
Current usage metrics show cumulative count of Article Views (full-text article views including HTML views, PDF and ePub downloads, according to the available data) and Abstracts Views on Vision4Press platform.
Data correspond to usage on the plateform after 2015. The current usage metrics is available 48-96 hours after online publication and is updated daily on week days.
Initial download of the metrics may take a while.