Fig. 9
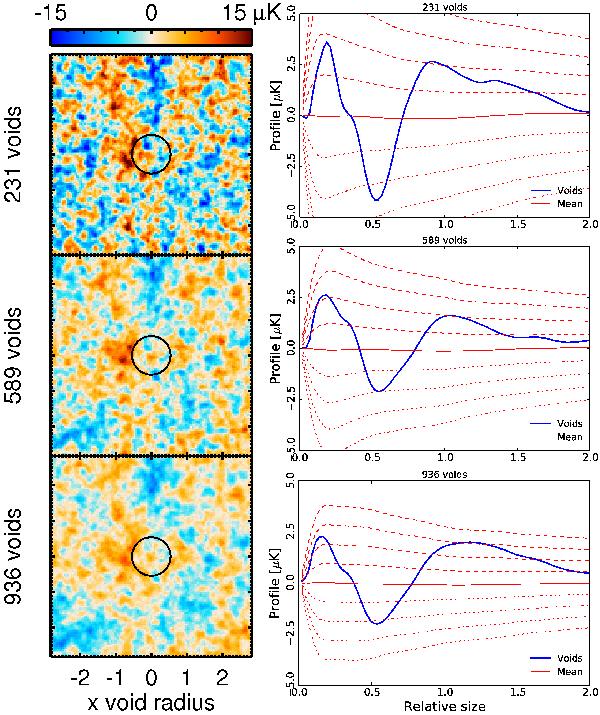
Stacked images (left) and photometry profiles (right) obtained for the voids of Sutter et al. (2012) after rescaling. From top to bottom, we show results obtained from stacking the largest 231, 589, and 936 voids. The black superimposed circles indicate the angular radius in terms of the effective radius after rescaling, at which the signal is highest. The statistical dispersion is reduced when more voids are stacked. However, the amplitude of the cold spot at about 0.5 times the effective void radius is mostly due to the surrounding hot shell, which is easiest to see in the bottom panel. This is also demonstrated by the 3σ signal detected using aperture photometry, seen at radii above 1.2 times the effective radius (for the case with 936 void). Dashed and dotted lines in the right-hand panels represent positive and negative error bars, respectively, from 1 to 4σ.
Current usage metrics show cumulative count of Article Views (full-text article views including HTML views, PDF and ePub downloads, according to the available data) and Abstracts Views on Vision4Press platform.
Data correspond to usage on the plateform after 2015. The current usage metrics is available 48-96 hours after online publication and is updated daily on week days.
Initial download of the metrics may take a while.