Fig. 7
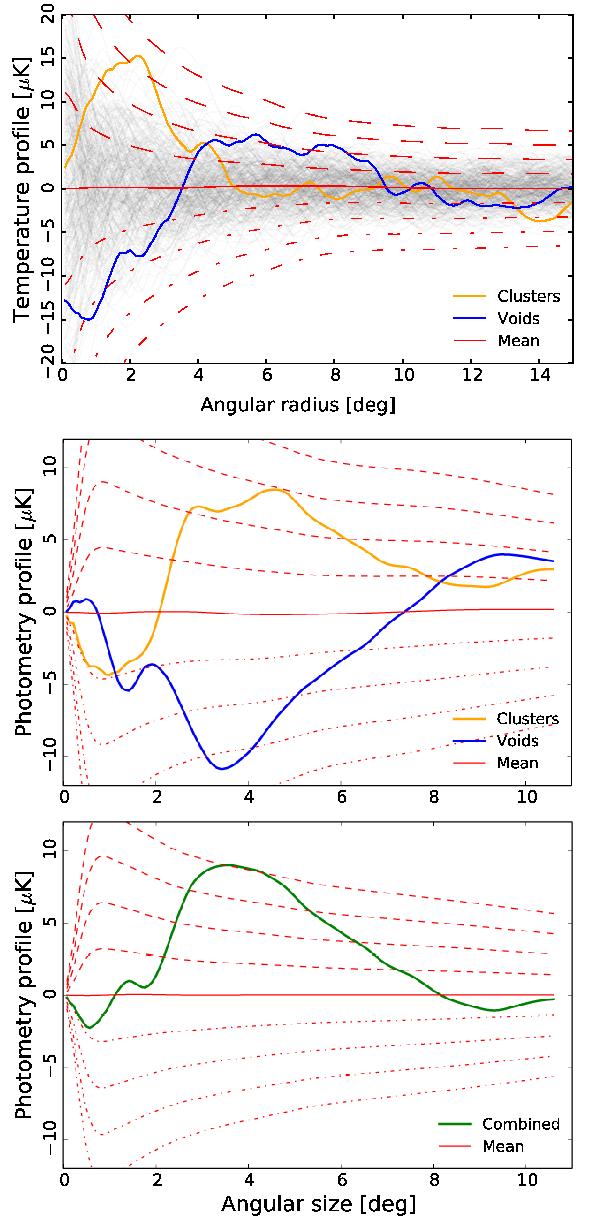
Temperature (top) and photometry (middle and bottom) profiles of the stacked CMB patches at the location of the 50 supervoids and 50 superclusters of GR08. The lower panel shows the combined photometry profile (i.e., the average cluster profile minus the average void profile). The significance is represented by 1, 2, 3, and 4σ level curves (dashed and dotted lines represent positive and negative error bars, respectively). These curves represent the dispersion of the 16 000 stacks of 50 CMB patches chosen at random positions (for illustration, we represent in grey 300 of the random profiles in the top panel).
Current usage metrics show cumulative count of Article Views (full-text article views including HTML views, PDF and ePub downloads, according to the available data) and Abstracts Views on Vision4Press platform.
Data correspond to usage on the plateform after 2015. The current usage metrics is available 48-96 hours after online publication and is updated daily on week days.
Initial download of the metrics may take a while.