Fig. 6
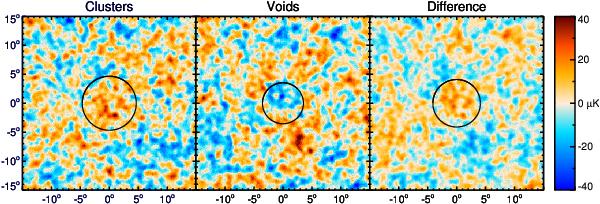
Stacked regions of Planck maps corresponding to the locations of the superstructures identified by GR08. From left to right we show the images resulting from stacking of the 50 superclusters, the 50 supervoids, and the difference of the two. The black circles superimposed indicate the angular radius at which the signal-to-noise ratio is highest. See Fig. 7 for the corresponding temperature and photometry profiles, as well as their statistical significance.
Current usage metrics show cumulative count of Article Views (full-text article views including HTML views, PDF and ePub downloads, according to the available data) and Abstracts Views on Vision4Press platform.
Data correspond to usage on the plateform after 2015. The current usage metrics is available 48-96 hours after online publication and is updated daily on week days.
Initial download of the metrics may take a while.