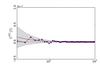
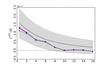
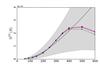
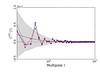
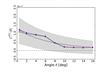
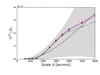
Fig. 5
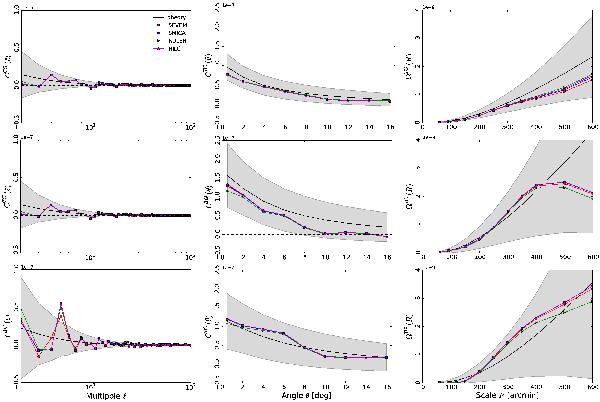
Observed and expected cross-correlation signal versus multipole ℓ for several surveys and different cross-correlation estimators. Columns from left to right correspond to CAPS, CCF, and SMHWcov. Rows from top to bottom represent NVSS, SDSS-CMASS/LOWZ, and SDSS-MphG. In each panel we show the expected cross-correlation (black line) and the ±1σ region (grey area).
Current usage metrics show cumulative count of Article Views (full-text article views including HTML views, PDF and ePub downloads, according to the available data) and Abstracts Views on Vision4Press platform.
Data correspond to usage on the plateform after 2015. The current usage metrics is available 48-96 hours after online publication and is updated daily on week days.
Initial download of the metrics may take a while.