Fig. 4
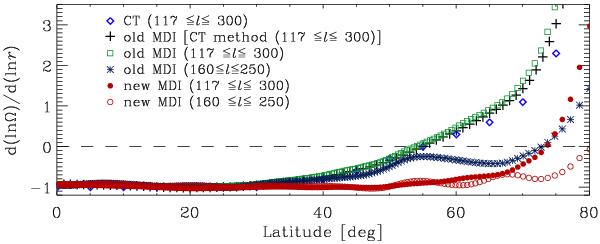
Estimates of dlnΩ/dlnr versus target latitude obtained from 23 MDI data sets using various methods. Blue diamonds show the values measured from Fig. 4 of CT, while black pluses show the results of changing the data sets and averaging, as described in the text. Green squares and dark blue stars show the results of our analysis of the old MDI data for the full and restricted modes, respectively. Filled and open red circles show the corresponding results for the new MDI data.
Current usage metrics show cumulative count of Article Views (full-text article views including HTML views, PDF and ePub downloads, according to the available data) and Abstracts Views on Vision4Press platform.
Data correspond to usage on the plateform after 2015. The current usage metrics is available 48-96 hours after online publication and is updated daily on week days.
Initial download of the metrics may take a while.