| Issue |
A&A
Volume 570, October 2014
|
|
|---|---|---|
| Article Number | L9 | |
| Number of page(s) | 5 | |
| Section | Letters | |
| DOI | https://doi.org/10.1051/0004-6361/201424630 | |
| Published online | 21 October 2014 | |
Constraints on photoevaporation models from (lack of) radio emission in the Corona Australis protoplanetary disks⋆
1
European Southern Observatory,
Karl-Schwarzschild-Str. 2,
85748
Garching,
Germany
e-mail:
This email address is being protected from spambots. You need JavaScript enabled to view it.
; This email address is being protected from spambots. You need JavaScript enabled to view it.
2
Centro de Radioastronomía y Astrofísica, Universidad Nacional
Autónoma de México, 58090
Morelia,
Mexico
3
Academia Sinica, Institute of Astronomy and
Astrophysics, PO Box
23-141, Taipei
106,
Taiwan
4
Department of Astrophysics, University of Vienna,
Türkenschanzstraße 17,
1180
Vienna,
Austria
5
Lunar and Planetary Laboratory, University of
Arizona, Tucson,
AZ
85721,
USA
6
Joint Institute for VLBI in Europe, Postbus 2, 7990 AA
Dwingeloo, The
Netherlands
7
INAF-Osservatorio Astrofisico di Arcetri, Largo E.
Fermi, 50125
Firenze,
Italy
8
Excellence Cluster Universe, Boltzmannstr. 2, 85748
Garching,
Germany
Received: 18 July 2014
Accepted: 24 September 2014
Abstract
Photoevaporation due to high-energy stellar photons is thought to be one of the main drivers of protoplanetary disk dispersal. The fully or partially ionized disk surface is expected to produce free-free continuum emission at centimeter (cm) wavelengths that can be routinely detected with interferometers such as the upgraded Very Large Array (VLA). We use deep (rms noise down to 8 μJy beam-1 in the field of view center) 3.5 cm maps of the nearby (130 pc) Corona Australis (CrA) star formation (SF) region to constrain disk photoevaporation models. We find that the radio emission from disk sources in CrA is surprisingly faint. Only three out of ten sources within the field of view are detected, with flux densities of about 102 μJy. However, a significant fraction of their emission is nonthermal. Typical upper limits for nondetections are 3σ ~ 60 μJy beam-1. Assuming analytic expressions for the free-free emission from extreme-UV (EUV) irradiation, we derive stringent upper limits to the ionizing photon luminosity that impinges on the disk surface ΦEUV < 1−4 × 1041 s-1. These limits constrain ΦEUV to the low end of the values needed by EUV-driven photoevaporation models to clear protoplanetary disks within the observed few Myr timescale. Therefore, at least in CrA, EUV-driven photoevaporation is unlikely to be the main agent of disk dispersal. We also compare the observed X-ray luminosities LX of disk sources with models in which photoevaporation is driven by such photons. Although predictions are less specific than for the EUV case, most of the observed fluxes (upper limits) are roughly consistent with the (scaled) predictions. Deeper observations, as well as predictions spanning a wider parameter space, are needed to properly test X-ray driven photoevaporation.
Key words: protoplanetary disks / stars: formation / stars: pre-main sequence
Appendix A is available in electronic form at http://www.aanda.org
© ESO, 2014
1. Introduction
The mechanisms that drive the dispersal of disks around young stars are not well understood. Photoevaporation of the disk driven by high-energy radiation from the central star is thought to act in concert with viscous accretion and the planet formation. A recent review of the topic is presented by Alexander et al. (2014). Several models have been put forward to describe disk photoevaporation, including analytical flow solutions (e.g., Hollenbach et al. 1994; Gorti & Hollenbach 2009) and hydrodynamical simulations (e.g., Alexander et al. 2006; Owen et al. 2010). Mid-infrared forbidden lines such as the [Ne II] have been used to infer the presence of photoevaporative flows (e.g., Pascucci & Sterzik 2009) from disks around low-mass young stellar objects (YSOs).
Disks in CrA within the VLA primary beam.
Pascucci et al. (2012) and Owen et al. (2013, hereafter Pascucci12 and Owen13, respectively) published predictions for the radio-continuum emission from (partially) ionized disk surfaces around low-mass YSOs that may be photoevaporating. Pascucci12 showed that free-free emission from the disk surface is directly proportional to the ionizing stellar radiation1 that reaches the disk. If the photoevaporation is driven by X-rays (hν>0.1 keV), the interaction of photons with matter is more complex and the resulting gas temperatures and ionization fraction can depart considerably from the ~ 104 K and ~1 characteristic of the EUV case. The effects of far-UV radiation (6 <hν < 13.6 eV) add to the chemical complexity (Gorti & Hollenbach 2009), but this type of radiation is relevant even in photoevaporation models dominated by X-ray heating since it regulates the destruction of molecular coolants. Deep radio observations of many protoplanetary disks are needed to better constrain photoevaporation models. Recently, Pascucci et al. (2014) analyzed the cm emission from 14 circumstellar disks and found EUV photon luminosities (ΦEUV) lower than 1 × 1042 s-1 for sources with no jets and lower than 5 × 1040 s-1 for three older systems in their sample, thus placing a tight constraint on photoevaporation models.
In this Letter we analyze the 8.5 GHz (3.5 cm) continuum emission of the ten protoplanetary disks within our VLA field of view toward the central part of the Corona Australis (hereafter CrA) star formation region. This nearby region has been studied in the past at all wavelengths from the cm radio to the X-rays (e.g., Choi et al. 2008; Lindberg et al. 2014; Peterson et al. 2011; Forbrich et al. 2007, and references therein). The distance to CrA is ≈ 130 ± 10 pc (Neuhäuser & Forbrich 2008).
2. Data
The data analyzed here were presented in Liu et al. (2014, hereafter Liu14) and are part of a larger VLA2 program to monitor the time variability of radio sources in nearby, low-mass star formation regions. One of the main products of the program are radio continuum images with sensitivity down to a few microjansky.
The main continuum map used here concatenates 14 VLA epochs in 2012. It covers the continuous frequency range from 8 GHz (3.7 cm) to 9 GHz (3.3 cm) and reaches an rms noise of σ ~ 8 μJy beam-1 in the center of the field. The half-power beam width (HPBW) of the primary beam is 315′′, and the beamwidth at 10% power is 530′′. The synthesized HPBW is 4.6″ × 2.1″, PA = − 179.4°. More details of the observations are described in Liu14. Analysis of the data was performed in CASA (McMullin et al. 2007).
3. Results
3.1. Source list
We compiled a list of the protoplanetary disks in CrA and searched for their radio continuum emission in our deep VLA images, restricting ourselves to sources within the 10% response level of the primary beam (the interferometric field of view). Protoplanetary disks were identified based on the catalogs of Currie & Sicilia-Aguilar (2011; hereafter CSA11) and Sicilia-Aguilar et al. (2013; hereafter SA13). CSA11 used Spitzer IRAC and MIPS photometry and IRS spectroscopy in their models, whereas SA13 complemented their data with Herschel far-infrared PACS photometry.
Table 1 lists the basic properties of the disks in CrA, and Fig. 1 shows the deep radio map with the targets labeled. We only consider objects classified as primordial, pre-transitional, or transitional disks (roughly equivalent to class II YSOs). The age of the considered sources is 1 to 3 Myr (CSA11).
3.2. Radio-continuum of disks in CrA
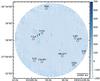 |
Fig. 1 Deep coadded VLA 3.5 cm (8.5 GHz) image of CrA. The image is corrected for primary-beam attenuation down to 10% response (530′′ diameter). The synthesized HPBW is 4.6″ × 2.1″, PA = − 179.4°. The disk sources listed in Table 1 are marked with circles and labeled. The intensity scale is in units of μJy beam-1. |
The radio-continuum emission of YSOs associated with disks can in principle receive contributions from several physical mechanisms. Disk-photoevaporation models emphasize the contribution from the free-free emission of the photoionized disk wind (Avalos & Lizano 2012, Pascucci12, Owen13). Free-free emission from magnetohydrodynamical jets dominates in class 0 and I YSOs (e.g., Anglada et al. 1998; Reipurth et al. 2004), but their contribution in class IIs is probably smaller. The models of Shang et al. (2004) (aimed at class I YSOs) predict a 3.5 cm flux of 16 μJy at 140 pc for their lowest jet mass-loss rate calculation of 3 × 10⁻⁸M⊙ yr-1. Typical mass-loss rates in class II YSOs are lower. Therefore, we expect the jet free-free contamination to be below the noise. In contrast, gyrosynchrotron emission from active magnetospheres can contribute significantly and even dominate the radio-continuum emission in class II and III YSOs (e.g., Gibb 1999; Forbrich et al. 2007). Finally, it is also possible that large dust grains emit significantly at short cm wavelenths, for example, in TW Hydrae (Wilner et al. 2005, Pascucci12). However, this may not be typical. Rodmann et al. (2006) investigated the dust and free-free contributions at 7 mm in protoplanetary disks and find that ~80% of the emission stems from dust. Assuming a dust spectral index typical of disks α = 2 to 2.5 (e.g., Ricci et al. 2010), this translates into only ~11% to 5% dust emission at 3.5 cm.
We searched for radio continuum emission in our deep map toward the disks listed in Table 1. The main result of our search is that seven out of ten targets are not detected. Five out of the seven non-detections have 3σ upper limits to the peak intensity ≤60 μJy beam-1 (see Table 1). This sets a tight constraint on disk-photoevaporation models (Sect. 4). The flux density for the detections was measured using the task imfit in CASA. Figure A.1 shows the individual field around each YSO.
Although it is difficult to quantify the relative contributions of thermal (free-free) and nonthermal (gyrosynchrotron) emission for the detections, the dominant mechanism can be identified from the spectral index and the variability properties. There is currently no information on the spectral index of the radio detections. However, the three detected disk sources (V709, R CrA, T CrA) were identified by Liu14 as highly variable. In maps of the 14 individual epochs that were coadded in the final deep image, these sources can sometimes be detected at a level of a few × 102 μJy (or up to ~1 mJy for V709) and then be nondetections even between observations separated by as little as less than one day (Liu14). This large variability shows that most of the cm flux of the detected sources is not due to stable, free-free emission from a photoevaporative flow, but most likely due to nonthermal (gyro)synchrotron emission from magnetic activity closer to the stellar surface (e.g., Liu14, Forbrich et al. 2007). We estimated the free-free contribution at 3.5 cm in the detections by assuming that free-free is relatively stable in time compared with (gyro)synchrotron emission (Liu14). Then we produced images that included the concatenated data from each of the individual epochs in which each of them is not detected and measured the fluxes. We obtain free-free fluxes Sff,V709 ≲ 507 ± 88 μJy (~57% of the total flux), Sff,RCrA ≲ 183 ± 20 μJy (~64%), and Sff,TCrA ≲ 170 ± 26 μJy (~94%). These are still strict upper limits to the free-free emission. If any of the additional processes mentioned above is significant, it would push down the upper limits to the ionizing fluxes derived in Sect. 4.
The X-ray properties of the radio-detected sources also indicate that radio emission, when bright, is mainly due to magnetospheric activity. Forbrich & Preibisch (2007) presented a deep Chandra observation of CrA. From the spectral shape and time-domain properties of the sources in CrA, these authors conclude that the YSOs X-ray emission is dominated by coronal activity, consistent with our interpretation of the cm detections as having significant coronal (gyro)synchrotron emission. Table 1 also lists the X-ray luminosities in the 0.2−8 keV band of the disk sources in CrA. Note that V709 is the most luminous in X-rays (it also shows variations up to ~50% within days, Forbrich & Preibisch 2007). R CrA is the third most luminous X-ray source and shows variations of a factor of 5 within days. In contrast, T CrA is barely detected in X-rays, and there is no information on its variability (Forbrich & Preibisch 2007).
4. Implications for models of disk photoevaporation
We used our observations to constrain possible models of protoplanetary disk photoevaporation. First we compared them quantitatively with predictions from EUV-driven photoevaporation models. Because the free-free emission is directly proportional to the EUV luminosity that reaches the disk (ΦEUV), we can use Eq. (2) of Pascucci12 to derive upper limits to ΦEUV. The main assumptions here are that the surface of the disk is almost fully ionized at 104 K and that the fraction of EUV photons absorbed by the disk is 0.7 (Hollenbach & Gorti 2009). We then compared this with X-ray driven models, for which there are still considerable uncertainties on the assumptions (Alexander et al. 2014). Therefore, in this case the comparison is more qualitative.
Table 2 summarizes the comparison with the predictions of Pascucci12. The constraints to models of EUV-driven photoevaporation are strong. Nine out of ten 3σ upper limits to the ionizing-photon luminosity are in the range ΦEUV < 1−4 × 1041 s-1. The EUV photon luminosity emitted by young pre-main sequence stars is constrained only for a handful of sources but is always found to be >1041 and often >1042 s-1 (Alexander et al. 2005; Herczeg 2007). However, these results are dependent on reddening, and not all the emitted photons necessarily reach the disk. Theoretical models typically use ΦEUV = 1041 s-1 or higher. On the lower end, Font et al. (2004) calculated models for ΦEUV = 1040 to 1042 s-1. More recent models that emphasize satisfying the constraint of a disk lifetime of a few Myr (e.g., Hernández et al. 2007) use ΦEUV = 1042 s-1 (e.g., Alexander et al. 2006). Alexander & Armitage (2009) presented a grid of models with coupled photoevaporation, viscous transport, and Type II migration. Using ΦEUV = 1042 s-1, these authors found a median disk lifetime of 4 Myr, consistent with observational constraints. Our observations show that at least for most of the disks in CrA, ΦEUV is on the low side of the broad range of ΦEUV used in models.
Upper limits to LX from Pascucci12 are listed in Table 2. These limits are at least one order of magnitude higher than the observed LX (Table 1). Therefore, if Sff ∝ LX, from these models we would expect to detect the sources at a level of ~1 to 10 μJy (below our sensitivity). For the three detections, the observed cm flux appears to be too high with respect to the model predictions. This could be explained if the stable cm flux, which we tentatively attribute to free-free emission from photoevaporation, still receives contributions from other processes (Sect. 3.2).
We now compare this with the radiative transfer calculations on hydrodynamical simulations presented by Owen13, who used a fiducial X-ray luminosity LX = 2 × 1030 erg s-1. For a given LX, Owen13 predicted a higher free-free flux than Pascucci12. The difference might be due to Owen13 using an unattenuated stellar spectrum, which may still contain substantial EUV and soft-Xray emission, but this is not certain. If we scale the frequency and distance of their predictions to 8 GHz and 130 pc3, we find that the expected 3.5 cm flux is S ~ 2 × 10² μJy (see Fig. 11 in Owen13). From Table 1 we see that, roughly, the three sources with LX close to 1030 erg s-1 have free-free fluxes (V7094, R CrA) or upper limits (G-95) consistent with these model predictions. We did not compare the results of Owen13 with our remaining sources with lower LX, since it is not clear which fraction of the predicted free-free emission is only due to the X-rays in the input stellar spectrum of Owen13.
Since photoevaporation driven purely by X-rays would produce lower free-free fluxes, deeper observations are needed to probe this regime. Model predictions spanning parameter space toward lower EUV and X-ray luminosities and different X-ray hardness are also needed.
Comparison with Pascucci12.
5. Conclusions
With the purpose of constraining models of protoplanetary disk clearing via photoevaporation, we inspected the 8.5 GHz (3.5 cm) continuum emission of disks in the nearby (130 pc) CrA star formation region. We used the deep (noise down to 8 μJy beam-1 in the center of the field of view) maps from our monitoring survey of low-mass YSOs (Liu14).
We found that disks are radio faint: seven out of ten targets are not detected. Five of the nondetections have 3σ upper limits ≤ 60 μJy beam-1, and all of them have 3σ ≤ 180 μJy beam-1. Furthermore, the radio variability and X-ray properties of the three radio detections indicate that a significant fraction of their radio flux is due to nonthermal processes, and not to the putative photoevaporative flow. We measured the stable 3.5 cm flux (~170 to 507 μJy) of the three detections and attribute it to free-free emission. Strictly, these are still upper limits to the fluxes from photoevaporation.
Using the prescription of Pascucci12 for EUV-driven photoevaporation, we derived tight upper limits to the rate of ionizing photons that reach the disk ΦEUV: nine out of ten disks in our field of view have ΦEUV < 1−4 × 1041 s-1. These upper limits discard the higher end of what EUV-driven photoevaporation models require to clear a protoplanetary disk within the observed timescale of a few Myr. In addition, the limits we derived from radio observations are lower than the previous estimates of the EUV photons emitted by the star derived by Alexander et al. (2005) and Herczeg (2007). This suggests that a significant fraction of the emitted EUV photons does not reach the disk. Our results, together with those recently reported by Pascucci et al. (2014), show that EUV photons are unlikely to be the main driver in disk dispersal.
We also compared our results with models of X-ray driven photoevaporation. This comparison is more qualitative because there is more room for variation in the model assumptions. Most of the observed fluxes (upper limits) are roughly consistent with the (scaled) predictions. Some detections appear to be too bright in the radio. However, their stable cm flux might still be slightly contaminated.
Future, deeper maps of this and other star formation regions (including variability information), together with X-ray and near-infrared data (to obtain accretion rates) will help to set tighter constraints on the mechanisms that drive protoplanetary disk photoevaporation. More specific predictions, in particular for lower EUV and X-ray luminosities, are also needed.
Online material
Appendix A: Individual maps of the targets
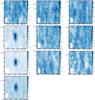 |
Fig. A.1 Deep VLA 3.5 cm (8.5 GHz) images of disk YSOs in CrA. A circle of 5′′ diameter is shown centered on the position given by CSA11 or SA13. Only the highly variable radio sources V709, R CrA, and T CrA are detected (see Table 1). The synthesized HPBW is 4.6″ × 2.1″, PA = − 179.4°. The intensity scale is in units of μJy beam-1. |
The extreme-UV (EUV) radiation, with 13.6 <hν < 100 eV.
The National Radio Astronomy Observatory is operated by Associated Universities, Inc. under cooperative agreement with the National Science Foundation.
Owen13 provide spectral indices between 8 GHz and their anchor predictions at 15 GHz of α ~ 0.5 for X-ray driven photoevaporation.
Note that the evolutionary stage of V709 is not clear: it is the only source in the sample that could be a debris disk, in which case no photoevaporation signal is expected.
Acknowledgments
This research made use of APLpy, an open-source plotting package for Python hosted at http://aplpy.github.com. R.G.-M. acknowledges funding from the European Community’s Seventh Framework Programme (/FP7/2007-2013/) under grant agreement No. 229517R. I.P. acknowledges support from the NSF Astronomy & Astrophysics Research Grant 1312962. The authors thank the anonymous referee for an insightful report.
References
- Acke, B., & van den Ancker, M. E. 2004, A&A, 426, 151 [NASA ADS] [CrossRef] [EDP Sciences] [Google Scholar]
- Alexander, R., Pascucci, I., Andrews, S., Armitage, P., & Cieza, L. 2014, in Protostars & Planets VI (University of Arizona Press), in press [arXiv:1311.1819] [Google Scholar]
- Alexander, R. D., & Armitage, P. J. 2009, ApJ, 704, 989 [NASA ADS] [CrossRef] [Google Scholar]
- Alexander, R. D., Clarke, C. J., & Pringle, J. E. 2005, MNRAS, 358, 283 [NASA ADS] [CrossRef] [Google Scholar]
- Alexander, R. D., Clarke, C. J., & Pringle, J. E. 2006, MNRAS, 369, 229 [NASA ADS] [CrossRef] [Google Scholar]
- Anglada, G., Villuendas, E., Estalella, R., et al. 1998, AJ, 116, 2953 [NASA ADS] [CrossRef] [Google Scholar]
- Avalos, M., & Lizano, S. 2012, ApJ, 751, 63 [NASA ADS] [CrossRef] [Google Scholar]
- Choi, M., Hamaguchi, K., Lee, J.-E., & Tatematsu, K. 2008, ApJ, 687, 406 [NASA ADS] [CrossRef] [Google Scholar]
- Currie, T., & Sicilia-Aguilar, A. 2011, ApJ, 732, 24 [NASA ADS] [CrossRef] [Google Scholar]
- Font, A. S., McCarthy, I. G., Johnstone, D., & Ballantyne, D. R. 2004, ApJ, 607, 890 [NASA ADS] [CrossRef] [Google Scholar]
- Forbrich, J., & Preibisch, T. 2007, A&A, 475, 959 [NASA ADS] [CrossRef] [EDP Sciences] [Google Scholar]
- Forbrich, J., Preibisch, T., Menten, K. M., et al. 2007, A&A, 464, 1003 [NASA ADS] [CrossRef] [EDP Sciences] [Google Scholar]
- Gibb, A. G. 1999, MNRAS, 304, 1 [NASA ADS] [CrossRef] [Google Scholar]
- Gorti, U., & Hollenbach, D. 2009, ApJ, 690, 1539 [Google Scholar]
- Herczeg, G. J. 2007, in IAU Symp. 243, eds. J. Bouvier, & I. Appenzeller, 147 [Google Scholar]
- Hernández, J., Hartmann, L., Megeath, T., et al. 2007, ApJ, 662, 1067 [NASA ADS] [CrossRef] [Google Scholar]
- Hollenbach, D., & Gorti, U. 2009, ApJ, 703, 1203 [NASA ADS] [CrossRef] [Google Scholar]
- Hollenbach, D., Johnstone, D., Lizano, S., & Shu, F. 1994, ApJ, 428, 654 [NASA ADS] [CrossRef] [Google Scholar]
- Lindberg, J. E., Jørgensen, J. K., Brinch, C., et al. 2014, A&A, 566, A74 [NASA ADS] [CrossRef] [EDP Sciences] [Google Scholar]
- Liu, H. B., Galván-Madrid, R., Forbrich, J., et al. 2014, ApJ, 780, 155 [NASA ADS] [CrossRef] [Google Scholar]
- LópezMartí, B., Eislöffel, J., & Mundt, R. 2005, A&A, 444, 175 [NASA ADS] [CrossRef] [EDP Sciences] [Google Scholar]
- McMullin, J. P., Waters, B., Schiebel, D., Young, W., & Golap, K. 2007, in Astronomical Data Analysis Software and Systems XVI, eds. R. A. Shaw, F. Hill, & D. J. Bell, ASP Conf. Ser., 376, 127 [Google Scholar]
- Meyer, M. R., & Wilking, B. A. 2009, PASP, 121, 350 [NASA ADS] [CrossRef] [Google Scholar]
- Neuhäuser, R., & Forbrich, J. 2008, The Corona Australis Star Forming Region, ASP Monograph Ser., ed. B. Reipurth, 735 [Google Scholar]
- Owen, J. E., Ercolano, B., Clarke, C. J., & Alexander, R. D. 2010, MNRAS, 401, 1415 [NASA ADS] [CrossRef] [Google Scholar]
- Owen, J. E., Scaife, A. M. M., & Ercolano, B. 2013, MNRAS, 434, 3378 [NASA ADS] [CrossRef] [Google Scholar]
- Pascucci, I., & Sterzik, M. 2009, ApJ, 702, 724 [NASA ADS] [CrossRef] [Google Scholar]
- Pascucci, I., Gorti, U., & Hollenbach, D. 2012, ApJ, 751, L42 [NASA ADS] [CrossRef] [Google Scholar]
- Pascucci, I., Ricci, L., Gorti, U., et al. 2014, ApJ, 795, 1 [NASA ADS] [CrossRef] [Google Scholar]
- Peterson, D. E., Caratti o Garatti, A., Bourke, T. L., et al. 2011, ApJS, 194, 43 [NASA ADS] [CrossRef] [Google Scholar]
- Reipurth, B., Rodríguez, L. F., Anglada, G., & Bally, J. 2004, AJ, 127, 1736 [NASA ADS] [CrossRef] [Google Scholar]
- Ricci, L., Testi, L., Natta, A., et al. 2010, A&A, 512, A15 [NASA ADS] [CrossRef] [EDP Sciences] [Google Scholar]
- Rodmann, J., Henning, T., Chandler, C. J., Mundy, L. G., & Wilner, D. J. 2006, A&A, 446, 211 [NASA ADS] [CrossRef] [EDP Sciences] [Google Scholar]
- Shang, H., Lizano, S., Glassgold, A., & Shu, F. 2004, ApJ, 612, L69 [NASA ADS] [CrossRef] [Google Scholar]
- Sicilia-Aguilar, A., Henning, T., Linz, H., et al. 2013, A&A, 551, A34 [NASA ADS] [CrossRef] [EDP Sciences] [Google Scholar]
- Wilner, D. J., D’Alessio, P., Calvet, N., Claussen, M. J., & Hartmann, L. 2005, ApJ, 626, L109 [NASA ADS] [CrossRef] [Google Scholar]
All Tables
All Figures
|
Fig. 1 Deep coadded VLA 3.5 cm (8.5 GHz) image of CrA. The image is corrected for primary-beam attenuation down to 10% response (530′′ diameter). The synthesized HPBW is 4.6″ × 2.1″, PA = − 179.4°. The disk sources listed in Table 1 are marked with circles and labeled. The intensity scale is in units of μJy beam-1. |
| In the text | |
|
Fig. A.1 Deep VLA 3.5 cm (8.5 GHz) images of disk YSOs in CrA. A circle of 5′′ diameter is shown centered on the position given by CSA11 or SA13. Only the highly variable radio sources V709, R CrA, and T CrA are detected (see Table 1). The synthesized HPBW is 4.6″ × 2.1″, PA = − 179.4°. The intensity scale is in units of μJy beam-1. |
| In the text | |
Current usage metrics show cumulative count of Article Views (full-text article views including HTML views, PDF and ePub downloads, according to the available data) and Abstracts Views on Vision4Press platform.
Data correspond to usage on the plateform after 2015. The current usage metrics is available 48-96 hours after online publication and is updated daily on week days.
Initial download of the metrics may take a while.