Free Access
Fig. 1
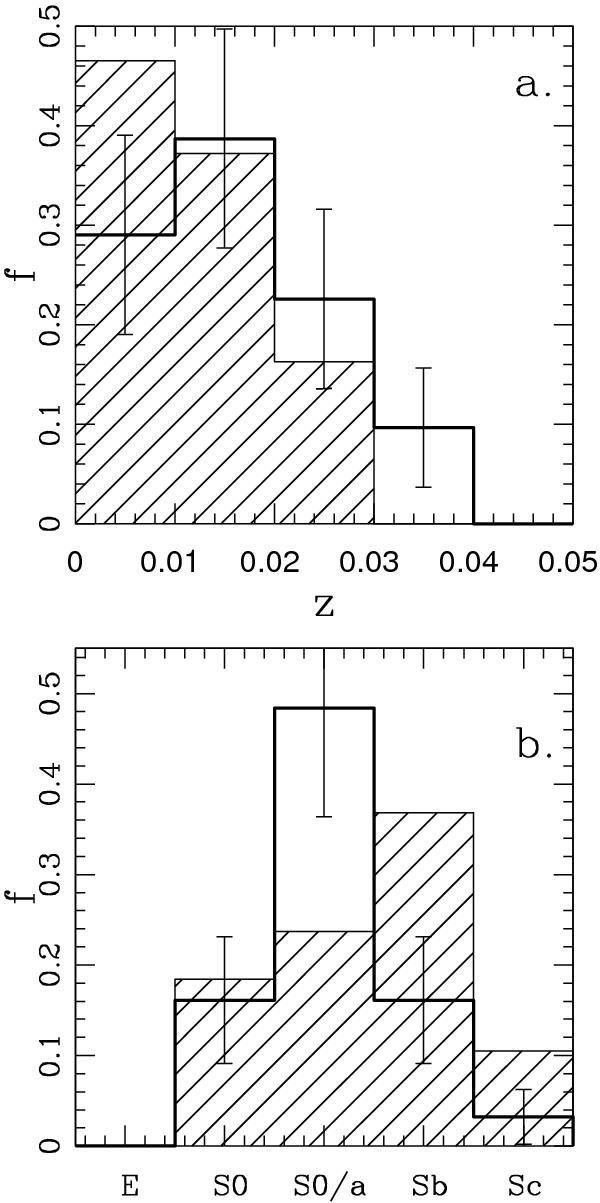
Redshift (panel a)) and Morphological type (panel b)) distribution of the Sy2 samples. The solid line defines the HBLR Sy2 population, while the hatched histogram the non-HBLR. Uncertainties are 1σ Poissonian errors and they are plotted only for the HBLR Sy2s for clarity.
Current usage metrics show cumulative count of Article Views (full-text article views including HTML views, PDF and ePub downloads, according to the available data) and Abstracts Views on Vision4Press platform.
Data correspond to usage on the plateform after 2015. The current usage metrics is available 48-96 hours after online publication and is updated daily on week days.
Initial download of the metrics may take a while.